
Did you know you can use Consteel to run second-order and buckling analyses on specific parts or elements of your model by defining a Custom Portion for the portion of interest?
The workflow starts in the Portions Manager, where you can manually group structural members, frames, columns, beams, bracings into Custom Portions. These are fully user-defined and, importantly, only these custom portions can be directly used for analysis. This allows you to isolate exactly the structural subsystem you want to investigate, without being constrained by the full model.
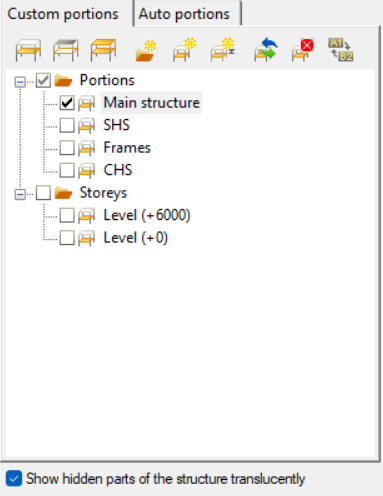
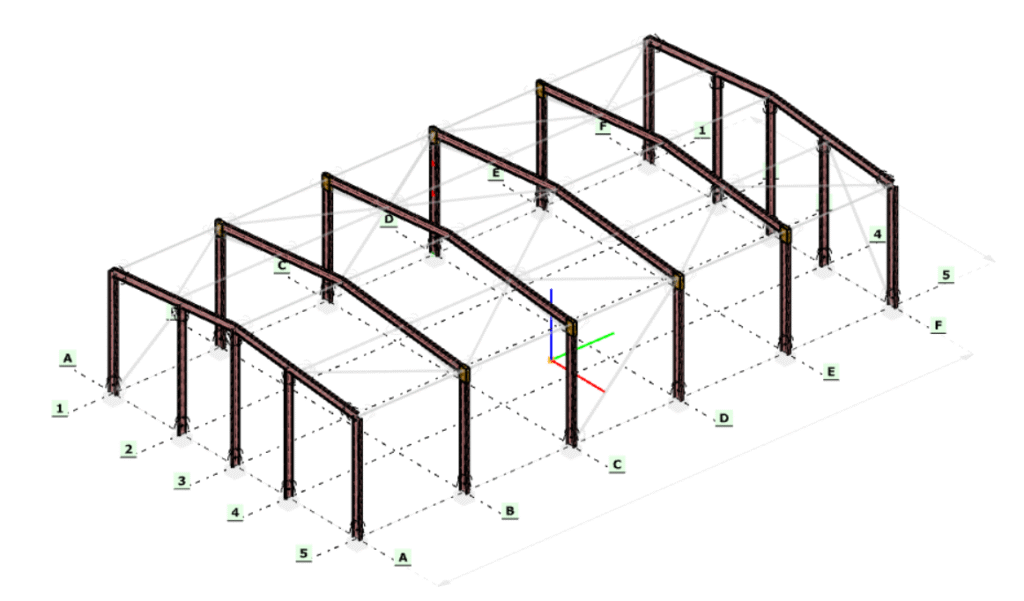
Once a portion is defined, it can be selected in the Analysis Settings, where you can choose whether second-order and buckling analyses should be performed on the entire model or only on the selected portion. The solver will then consider only that subset of elements when assembling the stiffness matrix and evaluating stability behavior.
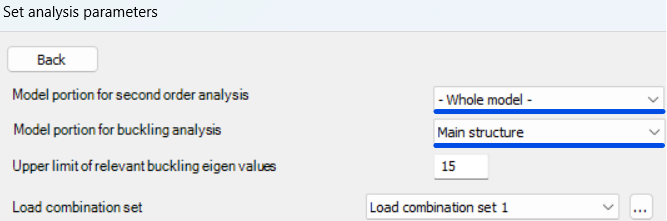
Running these analyses on specific portions has clear engineering advantages. Second-order effects and buckling phenomena are often governed by local structural behavior, such as a critical frame, a bracing system, or a column group, rather than the entire structure. By isolating these regions, you can:
- reduce computational effort and analysis time, especially for large models
- focus on the most critical load paths and instability mechanisms
- perform faster iterations during design refinement
- avoid unnecessary influence from non-relevant parts of the structure
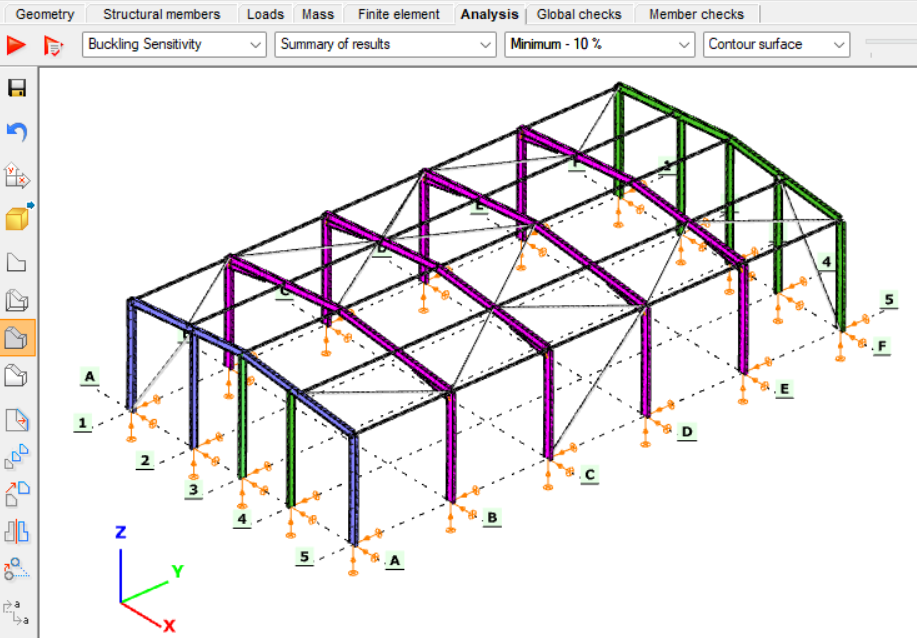
This targeted approach leads to more efficient and controlled stability analysis, particularly when investigating sensitive or highly utilized structural components.
Download the example model and try it!
Download modelIf you haven’t tried Consteel yet, request a trial for free!
Try Consteel for freeIntroduction
This article presents the calculation method for determining the buckling resistance of a pinned column with intermediate restraints in accordance with Eurocode standards. The procedure is based on an example from the Access Steel design examples collection and is compared with the calculation process implemented in Consteel’s steel member design functions, specifically within the Member Checks module.
In the following sections, a step-by-step guide is provided to demonstrate how the member check functionality can be applied to simple cases, highlighting both methodology and practical usage.
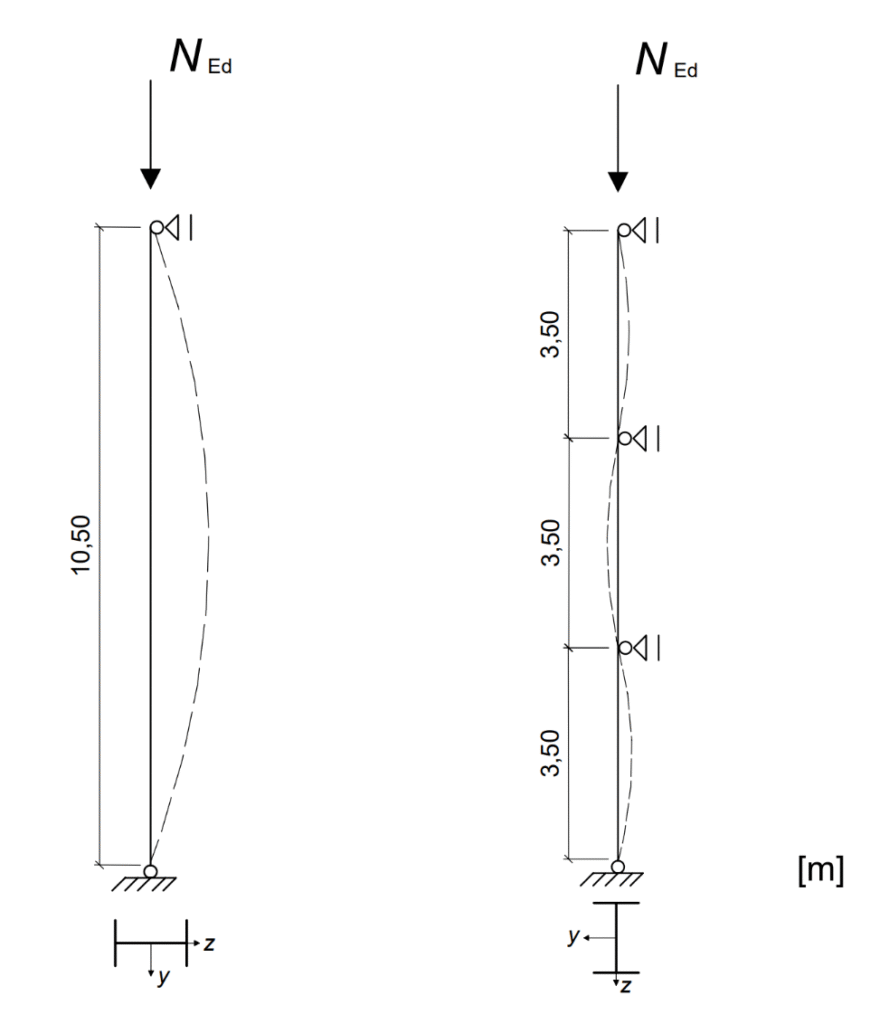
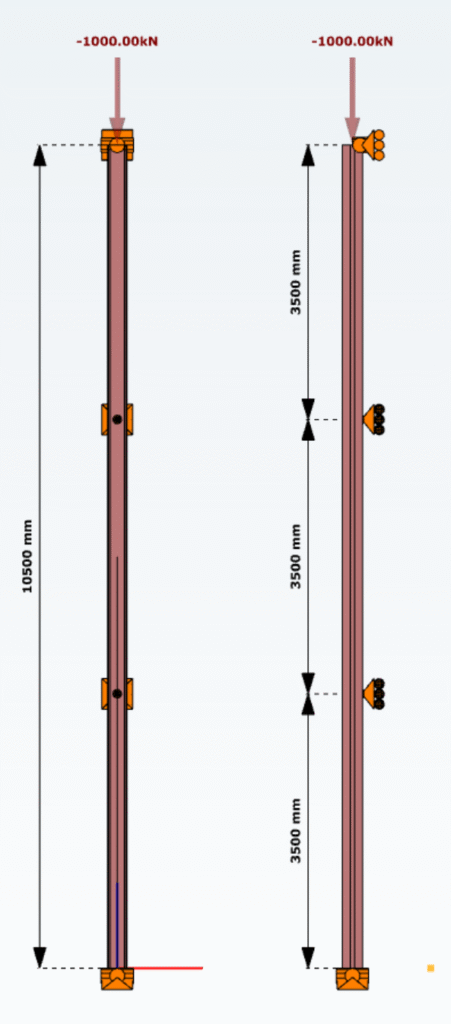
Input Data for the Example
The example considers a pinned column in a multi-storey building, subjected to a design axial force of $N_{Ed}$ = 1000 kN. The column has a total length of 10.50 m and is laterally restrained about the y–y axis at intervals of 3.50 m.
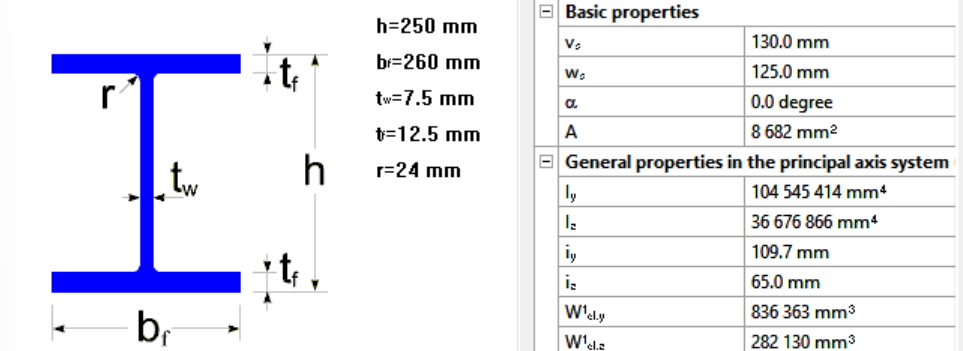
The member is a rolled HEA 260 section made of S235 steel. The cross-section is classified as Class 1. The geometric properties of the section are: height h = 250 mm, width b = 260 mm, web thickness $t_w$ = 7.5 mm, flange thickness $t_f$ = 12.5 mm, and fillet radius r = 24 mm. The cross-sectional area is A = 86.8 cm², with moments of inertia $I_y$ = 10450 cm⁴ and $I_z$ = 3668 cm⁴.
The material properties are defined according to EN 1993-1-1. Since the maximum thickness is less than 40 mm, the yield strength is taken as $I_y$ = 235 N/mm². The partial safety factors are γM0 = 1.0 and γM1 = 1.0.
Determining Design Buckling Resistance of a Compression Member
The design buckling resistance of the column $N_{b,Rd}$ is evaluated by determining the reduction factor χ for both principal buckling directions. This requires the calculation of the elastic critical forces $N_{cr}$, which form the basis for identifying the governing buckling mode.
Elastic critical force for the relevant buckling mode $N_{cr}$
The Young’s modulus is taken as $E=210000 \frac{N}{mm^2}$. The buckling lengths in the respective planes are $L_{cr,y} = 10.50m$ for buckling about the y–y axis and $L_{cr,z} = 3.50m$ for buckling about the z–z axis. Observe that the buckling lengths for the strong and weak axes differ according to the support conditions, which must be determined by the engineer in manual calculations.
$$N_{cr,y}=\frac{π^2*E*I_{y}}{L_{cr,y^2}}=1964.5 kN$$
$$N_{cr,z}=\frac{π^2*E*I_{z}}{L_{cr,z^2}}=6206.0 kN$$
In Consteel, the elastic critical force for the relevant buckling mode can be determined using the Individual Member Design approach. This is accessible in the Member Checks tab under the Steel module, where selected members can be added and evaluated.


Once a member is selected, the analysis results are automatically loaded, provided that first- or second-order analysis results are available. Ensure that the analysis has been run in the Analysis tab and the cross section check on the Global ckecks tab before proceeding to the Member Checks section.
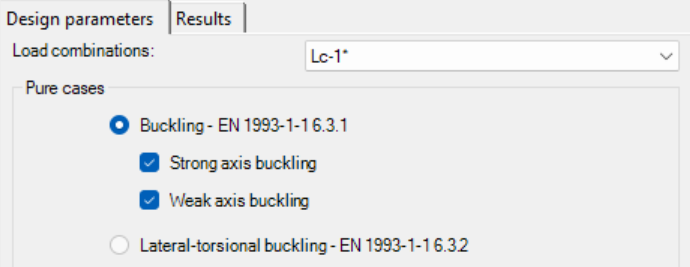
For the pinned column with intermediate restraints, the relevant buckling cases, strong and weak axis, are selected, and the dominant load combination is automatically indicated with a *. Consteel identifies the intermediate restraints separately for each direction and divides the member into segments accordingly to help determine the correct buckling lengths.
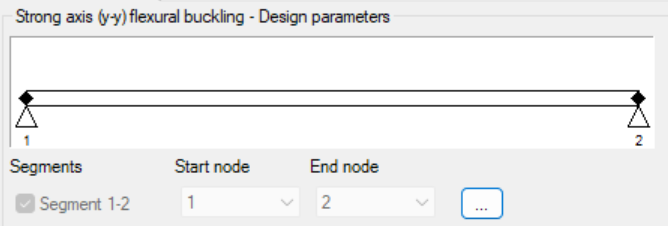
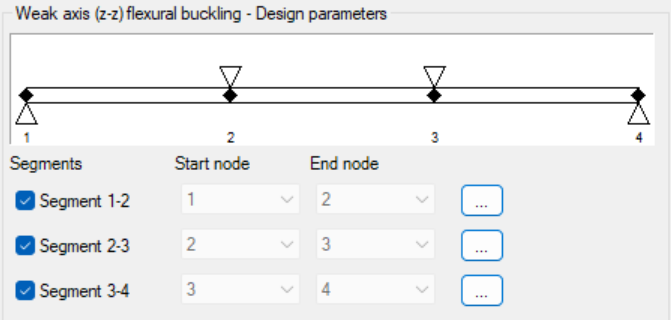
Design parameters for each segment are set with the three-dot icon:
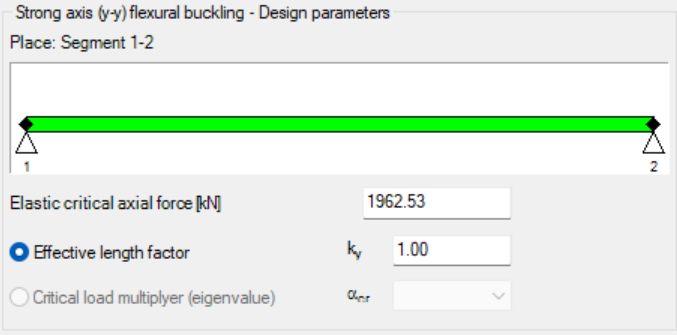
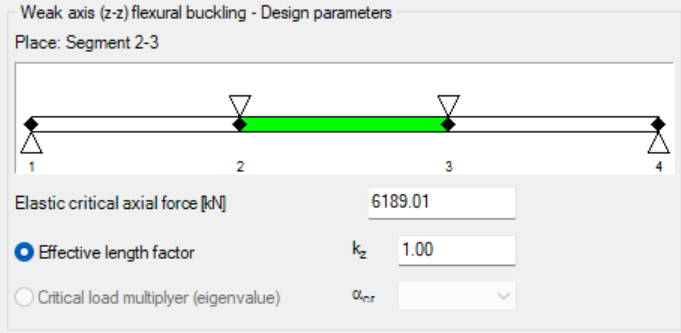
At this step, users must verify the assigned values. By default, the first value is applied, and the correct buckling shape or effective length factor should be confirmed based on engineering judgment.
In order to use the critical load multiplier selection option, make sure to perform the calculation first:

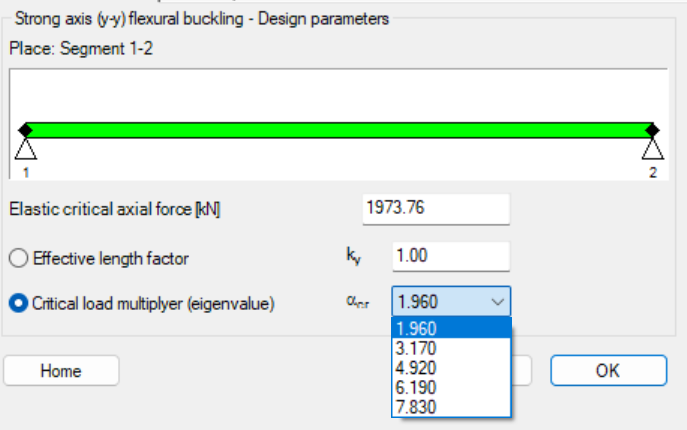
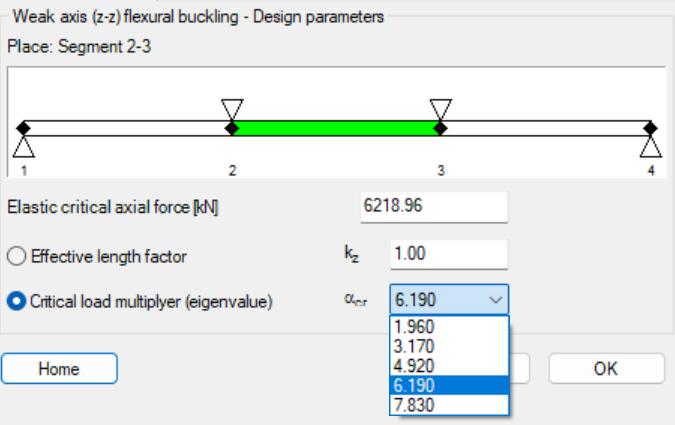
In order to check whether the correct critical load multiplier was selected, you can examine the effective length factor, which is calculated based on it (in this case, it is 1 for both directions). In our example, the relevant buckling shapes for the y–y and z–z directions are as follows:
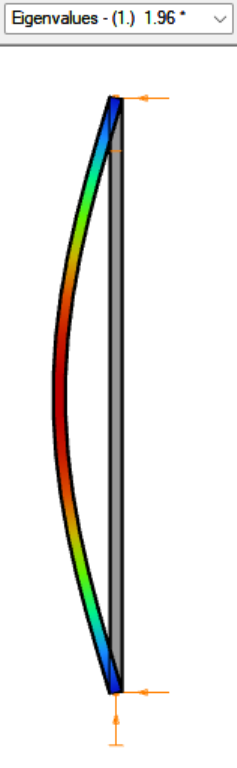
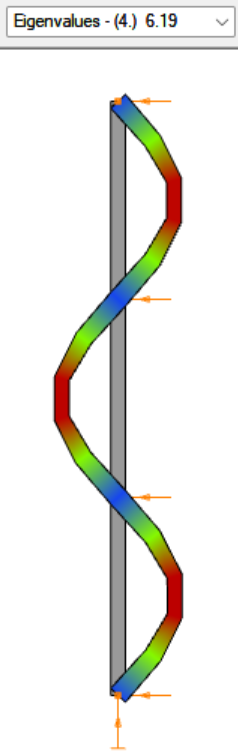
The elastic critical force $N_{cr}$ is calculated automatically, regardless of whether the effective length factor was entered manually or the critical load multiplier was selected.
| Access Steel – manual calculation | Consteel using the effective length factor | Consteel using the critical load multiplier | |
| $N_{cr,y}$ | 1964.5 kN | 1962.53 kN | 1973.76 kN |
| $N_{cr,z}$ | 6206.0 kN | 6189.01 kN | 6218.96 kN |
Once all parameters are defined, the design check is executed by clicking the Check button, and the results are displayed.
Results can be reviewed and filtered by member, load combination, and buckling case. Lateral-torsional buckling checks follow a similar procedure, with segment boundaries adjustable and critical moments calculated either analytically or using the critical load multiplier.
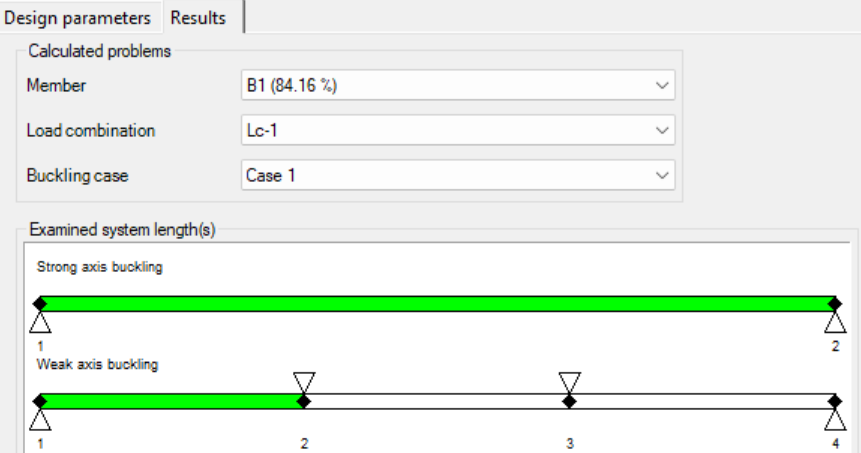
Non-dimensional slenderness
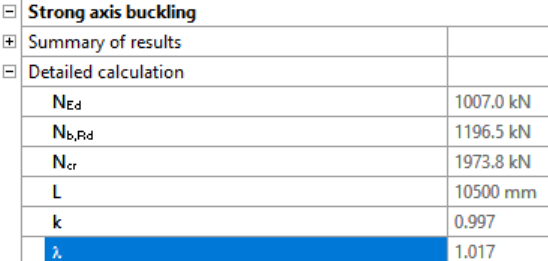
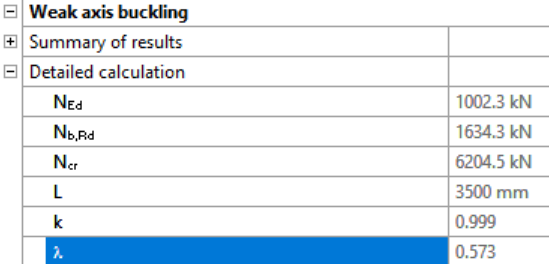
In order to determine the reduction factor, the non-dimensional slenderness λ must be calculated based on the elastic critical force corresponding to the relevant buckling mode.
$$\overline{\lambda_y} = \sqrt{\frac{A*f_y}{N_{cr,y}}}=\sqrt{\frac{86.8*23.5}{1965}}=1.016$$
$$\overline{\lambda_z} = \sqrt{\frac{A*f_z}{N_{cr,z}}}=\sqrt{\frac{86.8*23.5}{6206}}=0.573$$
In Consteel, the detailed calculations for strong and weak axis buckling can be reviewed separately on the Results tab:
Reduction factor
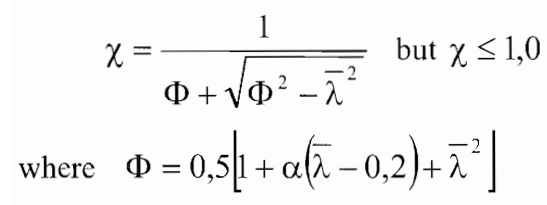
For axial compression, the value of χ corresponding to the relevant non-dimensional slenderness $\overline{\lambda}$ should be determined from the appropriate buckling curve in accordance with EN 1993-1-1 §6.3.1.2.
For $\frac{h}{b}= \frac{250mm}{260mm} = 0.96 < 1.2$ and $t_f = 12.5 mm< 100 mm$

- buckling about axis y-y, buckling curve b, imperfection factor $\alpha=0.34$
$$\varphi_y=0.5*[1+0.34(1.019-0.2)+1.019^2]=1.158$$
$$\chi_y=\frac{1}{1.158+\sqrt{1.158^2-1.019^2}}=0.585$$
- buckling about axis z-z, buckling curve c, imperfection factor $\alpha=0.49$
$$\varphi_y=0.5*[1+0.49(0.573-0.2)+0.573^2]=0.756$$
$$\chi_y=\frac{1}{0.756+\sqrt{0.756^2-0.573^2}}=0.801$$
$$\chi=min(\chi_y;\chi_z)$$
$$\chi=0.585<1.00$$
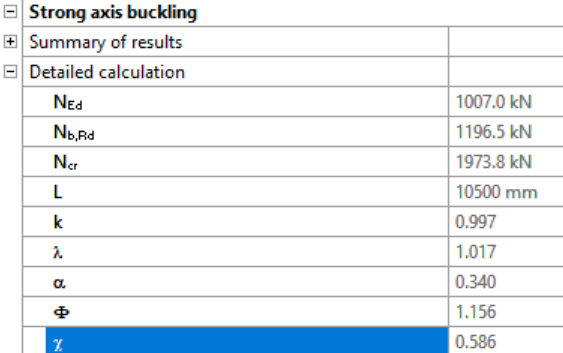
Design buckling resistance of a compression member
$$N_{b,Rd}=\chi*\frac{A*f_y}{\gamma_{M1}}=0.585*\frac{86.8*23.5}{1.0}=1193 kN$$
$$\frac{N_Ed}{N_{b,Rd}}=\frac{1000}{1193}=0.84<1.00$$

Conclusion
This example demonstrates the application of the isolated member approach for a simple compression member. For more complex cases or alternative stability verification methods, such as the imperfection approach or the general method, refer to the dedicated article on stability design methods, where their principles and applications are discussed in detail.
Download modelIntroduction
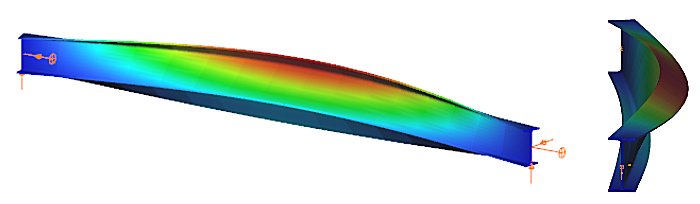
When a beam, bent in a plane, is allowed to move and twist freely between its two support points, in addition to bending, sudden perpendicular displacement and twisting may occur: causing the beam to deviate out of its original plane. This phenomenon is illustrated in Figure 1, showing a single supported beam with I-section bent around the strong axis. As the bending moment in the vertical plane increases, reaching a critical value, the beam undergoes abrupt lateral movement and twisting between the supports. This phenomenon is called lateral torsional buckling (LTB), which is a loss of stability mode that can apply to both perfect beams and real beams.
The design of the beam against LTB is fully analogous to the design of a compressed column against flexural buckling. The analogy is illustrated in Table 1, where the corresponding parameters are shown that affect the two buckling resistances:
| Flexural (column) buckling | Lateral torsional buckling |
|---|---|
| design force ($N_{Ed}$) | design moment ($M_{Ed}$) |
| critical force ($N_{cr}$) | critical moment ($M_{cr}$) |
| column slenderness ($\frac{}{\lambda}$) | beam slenderness ($\frac{}{\lambda}_{LT}$) |
| buckling reduction factor ($\chi$) | buckling reduction factor ($\chi_{LT}$) |
| buckling resistance ($N_{b,Rd}$) | buckling resistance ($M_{b,Rd}$) |
The critical moment of the perfect beam is determined at the location of the maximum value of the My,Ed design bending moment diagram. For a doubly symmetrical I cross-section:
$$M_{cr}=C_1\frac{\pi^2EI_z}{(k_z⋅L)^2}\left[\frac{I_\omega }{I_z}+ \frac{(k_zL)^2GI_t}{\pi^2EI_z}\right] ^{0.5} $$
where kz is the coefficient of restraint about the weak axis of the cross-section, G is the shear modulus, and It and Iω are the pure (St. Venant) and warping torsional moments of inertia of the cross-section. The value of the factor C1 depends on the shape of the bending moment diagram and its value can be found in appropriate tables and manuals. For a constant moment diagram, C1=1.0. The formula for the other design parameters, in particular the buckling reduction factor $\chi_{LT}$, depends on the design standard considered.
Lateral torsional buckling resistance by EN1993-1-1
The design of the beam against LTB (load capacity check) according to EC3-1-1 shall be carried out in the following steps:
gateThe evolution of compressed bar (column) design
One of the characteristic features of steel structures made of bars (e.g. lattice girders) is the compressed bar. We speak of a compressed bar when the structural element, which usually has a straight axis, is loaded by a compressive force P applied centrally (Figure 1).

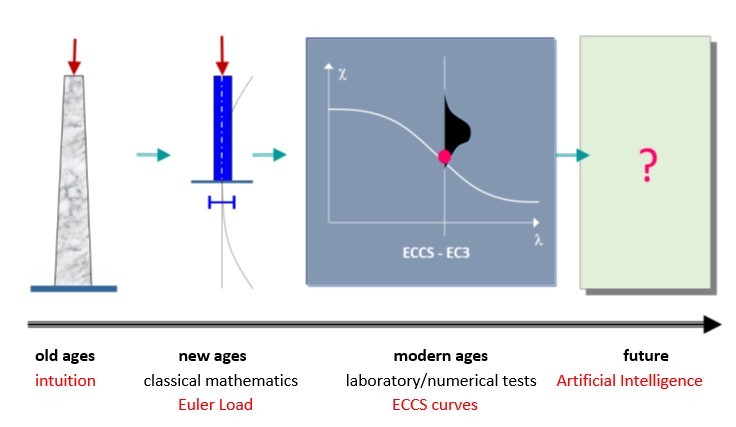
Figure 2 illustrates the evolution of compressed bar (column) design. In the beginning (in the old days), master builders determined the load-bearing capacity of compressed columns of different materials and sizes on the basis of the experience accumulated over the centuries, passed down from master to apprentice. A significant change was brought about by the application of classical mathematical differential analysis to engineering. The Swiss mathematician and physicist Euler (1707-1783) solved the problem of the deflection of a compressed elastic line, which could be applied to the solution of the elastic compressed bar (Euler’s force). In the following centuries, engineers recognised that Euler’s force only gave an acceptable approximation to the real load capacity of a compressed bar in certain cases (mainly for large slender bars). Many solutions for the bearing capacity of a compressed bar were developed that were more advanced than the Euler formula, but it was not until the huge structural engineering boom following World War II that significant changes were made. Compression bar experiments were carried out in every major structural laboratory in the world, and a database of over two thousand experiments was compiled from the results. The load capacity of the pressure bar was given by a formula based on the database, using the method of mathematical statistics.
This methodology is still dominant today: ‚the dimensioning of the compressed bar has become a political issue for the steel construction profession…‘. Understanding the principle of compressed bar design is therefore essential for the structural engineer.
The right side of the Figure 2 also contains a hint for the future. At the level of scientific research, it is already present that the load capacity of a real compressed column can be determined by mathematical-mechanical simulation. Indeed, in the near future, databases that go beyond anything we know today can be created using supercomputers. On the basis of such a gigantic database, artificial intelligence could, at least in principle, supersede existing engineering knowledge and methodology. But the reality is that structural engineering is not one of the pull sectors (such as the defense or automotive industries), so this new shift in design theory is certainly a long way off.
In the following, the Euler force and the experimentally based standard design formula, which are of major importance to structural steel engineering today, are discussed in detail.
Buckling strength of the ideal columns: the Euler force
Assume that the hinged compressed column shown in the Figure 3 has the following properties:
- perfectly straight,
- its material is perfectly linearly elastic,
- centrally compressed.
Under the above conditions, perform the compressed column experiment using Consteel software: run the Linear Buckling Analysis (LBA) calculation. The result is illustrated in Figure 3.
gateDid you know that you could use Consteel to Consider the shear stiffness of a steel deck as stabilization for steel members?
In many practical steel structures, trapezoidal decking is treated only as a load-bearing surface. In reality, when properly connected to the supporting members, it behaves as a shear diaphragm and contributes to the overall stability of the structure. This effect can be directly taken into account in Consteel by applying shear field stiffness to beam elements.

The stabilizing effect comes from the in-plane shear stiffness of the deck. Under horizontal loading, the sheeting deforms and transfers forces between structural members. This behavior can be described by a single parameter, the shear stiffness (S), which represents the resistance of the diaphragm against deformation.
The overall stiffness is influenced by several components, including the shear deformation of the sheet, profile geometry, fastener slip, and connection flexibility. These contributions together define how effectively the deck can restrain phenomena such as lateral-torsional buckling.
A key requirement for this behavior is proper fastening. Typically, the sheeting must be connected along its edges and fixed to supporting members at each rib to ensure reliable diaphragm action.
In engineering practice, shear stiffness is determined using standardized or manufacturer-based methods rather than detailed analytical models. Consteel supports several established approaches:
- Schardt/Strehl method (DIN 18807), based on parameters describing shear and warping deformation
- Improved Schardt/Strehl method, including the effect of fastener spacing
- Bryan/Davies method, considering additional structural parameters
- Eurocode-based method, using general geometric properties of the sheeting
These methods differ in complexity and required input data, but all aim to provide a realistic stiffness value for use in global analysis. If the sheeting is not fixed at every rib, the calculated stiffness must be reduced accordingly.
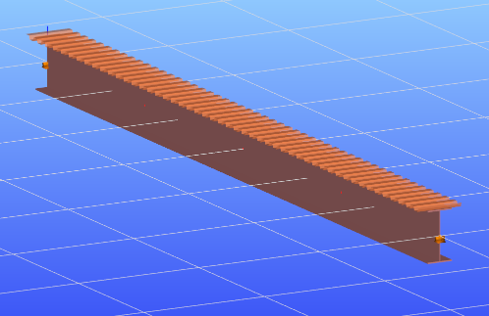
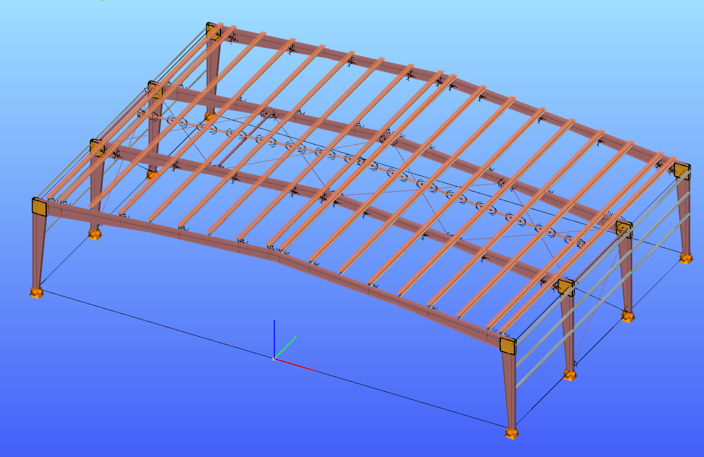
The shear field object in Consteel allows engineers to include the diaphragm effect without detailed shell modeling. The calculated shear stiffness can be assigned directly to beam elements, providing additional lateral restraint.
The process involves selecting a trapezoidal sheet profile, choosing the appropriate calculation method, and defining the relevant geometric and connection parameters. The software then determines the stiffness and incorporates it into the structural model.
Including shear stiffness in the analysis can lead to higher critical load factors and reduced displacements, resulting in more efficient structural designs. However, it also means that the decking becomes part of the stabilizing system.
Any later modifications to the sheeting, such as openings or changes in fastening, may reduce this effect and should therefore be carefully assessed.
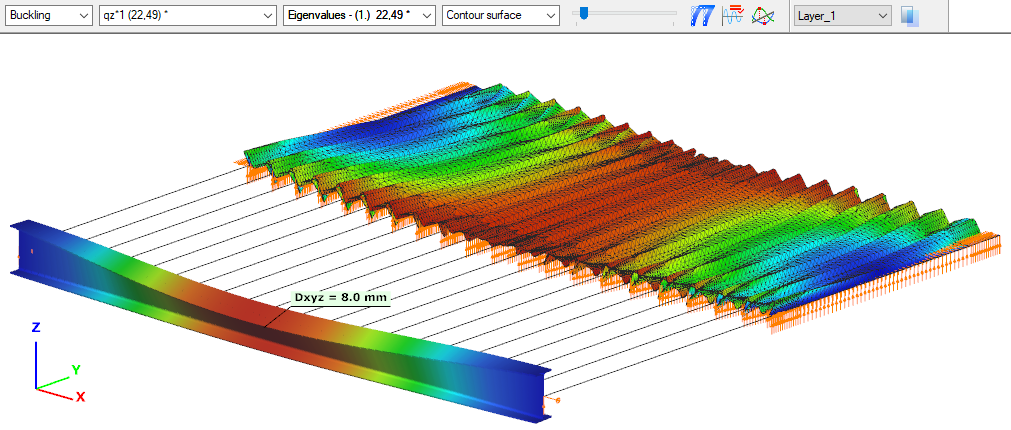
The shear stiffness of trapezoidal steel decking provides a measurable and often significant contribution to structural stability. By incorporating this effect in Consteel, engineers can achieve more realistic analysis results and optimize their designs while maintaining structural safety.
Download the example model and try it!
Download modelIf you haven’t tried Consteel yet, request a trial for free!
Try Consteel for freeConsteel 14 is a powerful analysis and design software for structural engineers. Watch our video how to get started with Consteel.
Contents
- Set analysis parameters
- Perform first and second order analysis
- Perform buckling analysis
- Analysis results in graphics and in tables
- Results: deformation, internal forces, reactions
Click the button bellow to download and read the full article at page 187-195.
In this paper a numerical study is presented which examines a steel frame with two different finite element programs. Stability failure is more frequent in a lot of cases than strength failure hence it is important to focus on these failure modes: global, in-plane-, out-of-plane -, lateral-torsional- and local buckling. Three models were used with different elements such as shell elements and 7 DOF beam elements. 7 DOF beam elements were used in the first model, shell elements were used in the other two. The first of the shell models gave too much local buckling shapes therefore it was improved with local constraints and that is the third model where global buckling shapes can be examined. There are three different procedures to calculate the resistance: (i) the general method, (ii) the method of the reduction factors, and (iii) the simulation. The analysis results of the different programs and design methods were compared to each other and to the manual calculation based on the Eurocode 3 standards.
gateThe new versions of the EN 1993-1-1 (EC3-1-1) and the EN 1993-1-5 (EC3-1-5) standards have introduced the general method designing beam-column structures; see [1] and [2]. The design method requires 3D geometric model and finite element analysis. In a series of papers we present this general design approach. The parts of the series are the following:
- Part 1: 3D model based analysis using general beam-column FEM
Click the button bellow to download and read the full article.
gateThe EN 1993 Part 1-1 (EC3-1-1) has introduced a new approach (called the “General Method”) to perform lateral-torsional buckling (LTB) assessment of beam-column structural components on the basis of elastic stability analysis. In the last years great research investigations went into the development of the method, see for instance [11,12] and also into the improvement of appropriate design software that is suitable to include the method and applicable for practical solutions [10]. The general objective of this paper is to review this issue from the point of view of the practice and contribute more effectively to understanding and resolving issues in the fields of practical application of the General Method. It is essentially significant to define the minimal analysis tools for the practice which are required for the accuracy of the method but on the other hand simple enough to make the modeling and calculation efficient. The paper briefly presents the theoretical background and the practical application of the elastic stability analysis of beam-columns that is necessary for the accurate evaluation of the General Method. The elastic stability analysis is verified by benchmark examples and also by shell finite element analysis. The application of the design method is demonstrated in the field of irregular structural members, especially web-tapered members and frames. The paper analyses the new theoretical results in the field of LTB of webtapered members that have led to prohibitive statements in some National Annex for EC3-1-1 concerning the segment method in the analysis of these members. It is shown that a comprehensive design method that is based on an appropriate segmented model and the General Method is efficient as well as reliable for conceptual design and with some restrictions also for detailed design.
Click the button bellow to download and read the full article.
gateStability analysis and design have always played a key role in the process of verification of steel structures. The possible analysis methods and design procedures have a long history with plentiful literature providing various proposals for the engineers. This paper concentrates on the use of different types of eigenvalue analysis as a simple and powerful tool for stability design. Nowadays almost all the engineering software products have some kind of eigenvalue analysis options so these tools are easily available for the practicing engineers providing them a deeper look on the structural behavior. Various types of application possibilities are reviewed and new methods are proposed supporting the most up-to-date standard procedures of different levels from the isolated member design to the partial or global structural stability design. The suitable theoretical (both mathematical and mechanical) background is developed and the numerical procedure is implemented. The technique is applicable for a wide range of structural types and stability problems making the automatic effective length calculation possible in general without the use of any iterative process or tabulated values for certain cases. An application example is presented showing the comprehensiveness of the methods, and special efficiency indicators are presented in order to supply information about the adequacy of the applied design method.
Click the button below to download and read the full article.
gate