- Contenuti
Comparative study for wind load evaluation using simulation results on simple buildings with flat and duopitched roofs
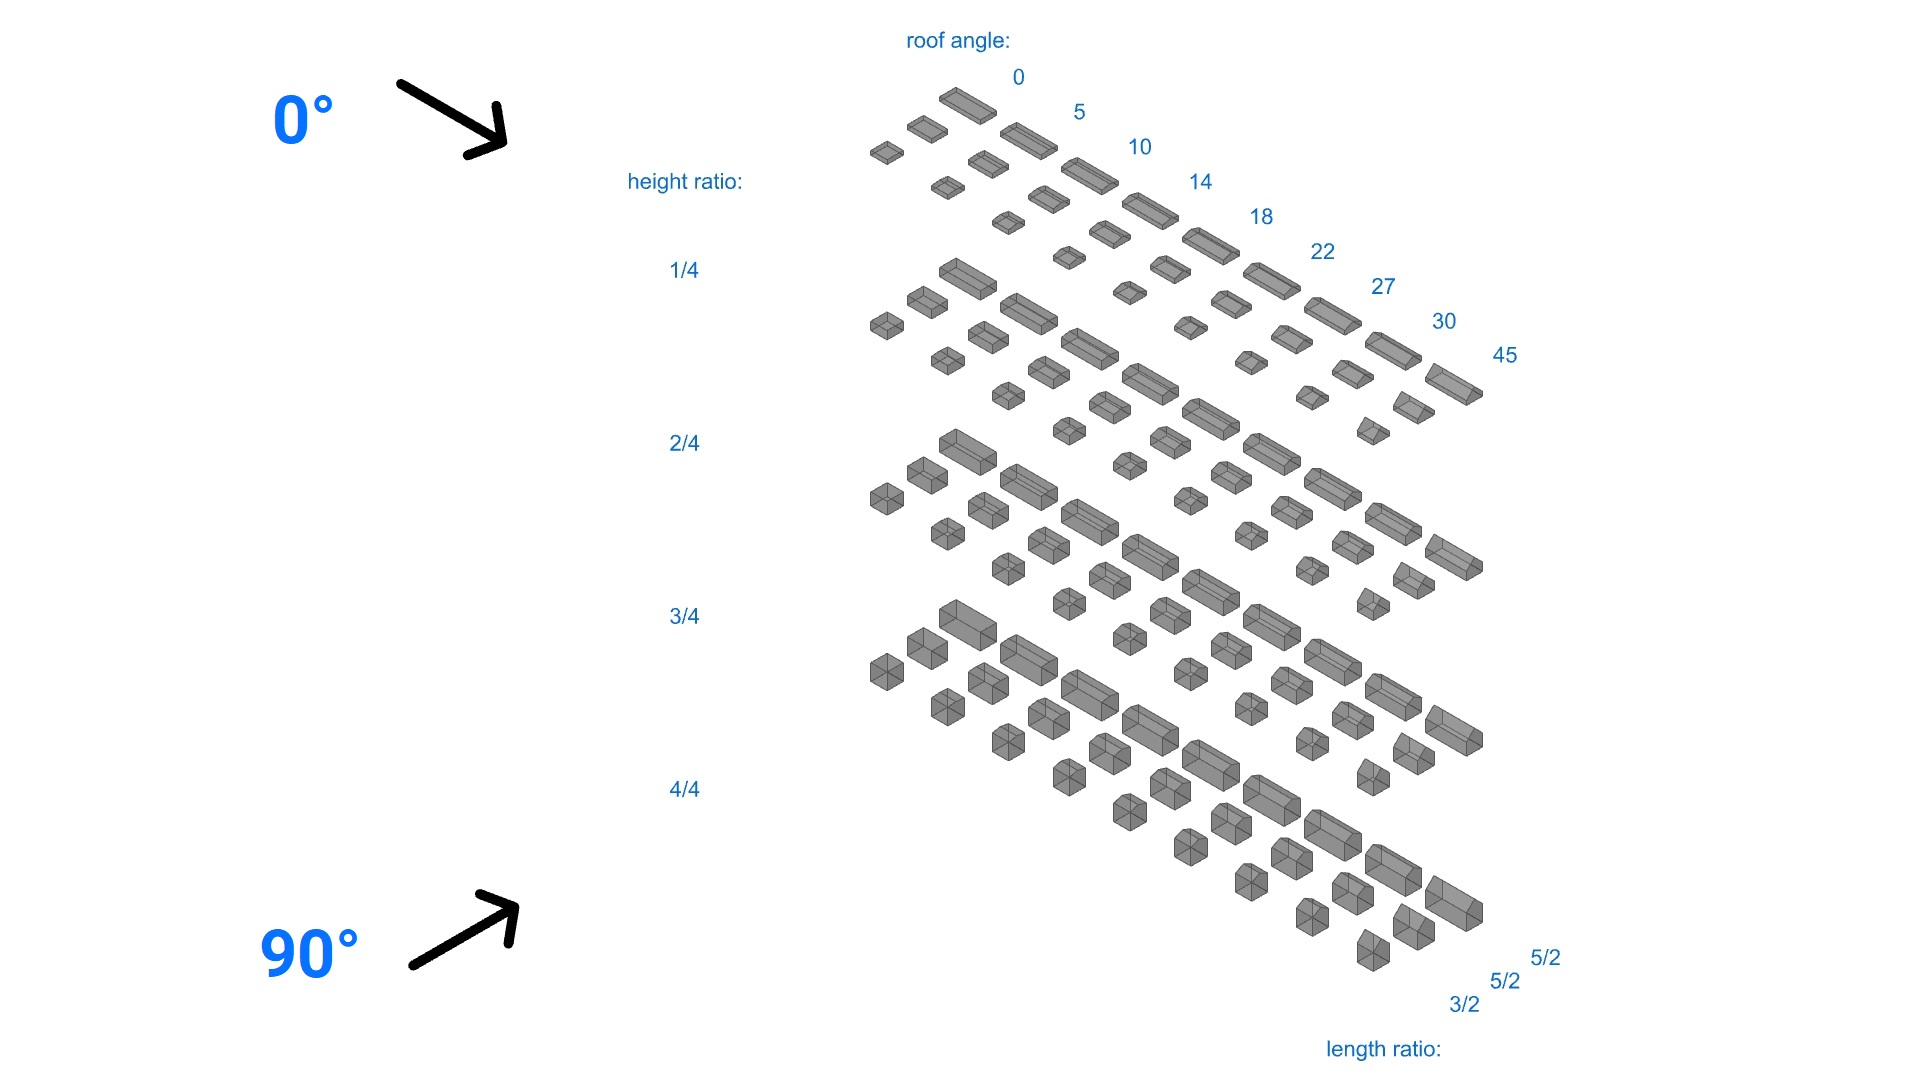
This study explores how Computational Fluid Dynamics (CFD)–based pressure simulation results can be compared and aligned with wind tunnel experiments and standardized design methods, reflecting the practical process engineers follow when assessing wind loads. The aim is to provide a framework for interpreting and applying simulation outputs with more confidence, supported by a clear workflow. To ensure that the findings are robust and generalizable, the analysis is grounded in a comprehensive parametric dataset: the Tokyo Polytechnic University (TPU) database of isolated low-rise buildings without eaves. This resource contains detailed pressure coefficient data for 116 building models—featuring flat, gable, and hip roofs—tested under eight wind directions, yielding more than 800 individual cases for comparison. To align these wind tunnel tests with the standard procedures the main orthogonal directions were investigated.

Compliance with standards
Before validating CFD results against established references, it is important to set the Eurocode baseline for wind load evaluation. From the wind effect side, a previous article covers how the specific wind profiles are determined and harmonized with the simulations during the preprocess phase, while for wind actions the Eurocode defines two main approaches:
- Wind pressure on surfaces – expressed through pressure coefficients for a range of building geometries.
- Wind forces on special structures – i.e. lattice towers.
Since CFD inherently produces surface pressure distributions, this study focuses exclusively on the first approach—wind pressure on surfaces—applied to closed buildings. For the purposes of this comparison, only vertical walls and simple roof types (flat and duopitched) were considered.
Under Eurocode procedures, building surfaces are subdivided into zones whose dimensions are determined by the building’s proportions. In practice, the characteristic zoning length, e , defines the extent of the regions for which local pressure coefficients are specified.
Therefore, to ensure a coherent comparison between wind tunnel tests and simulation results, the mesh refinement must be adjusted accordingly, for each previously presented geometrical case of the dataset for both principal orthogonal directions, which in turn makes a parametric study indispensable.
Parametric methodology
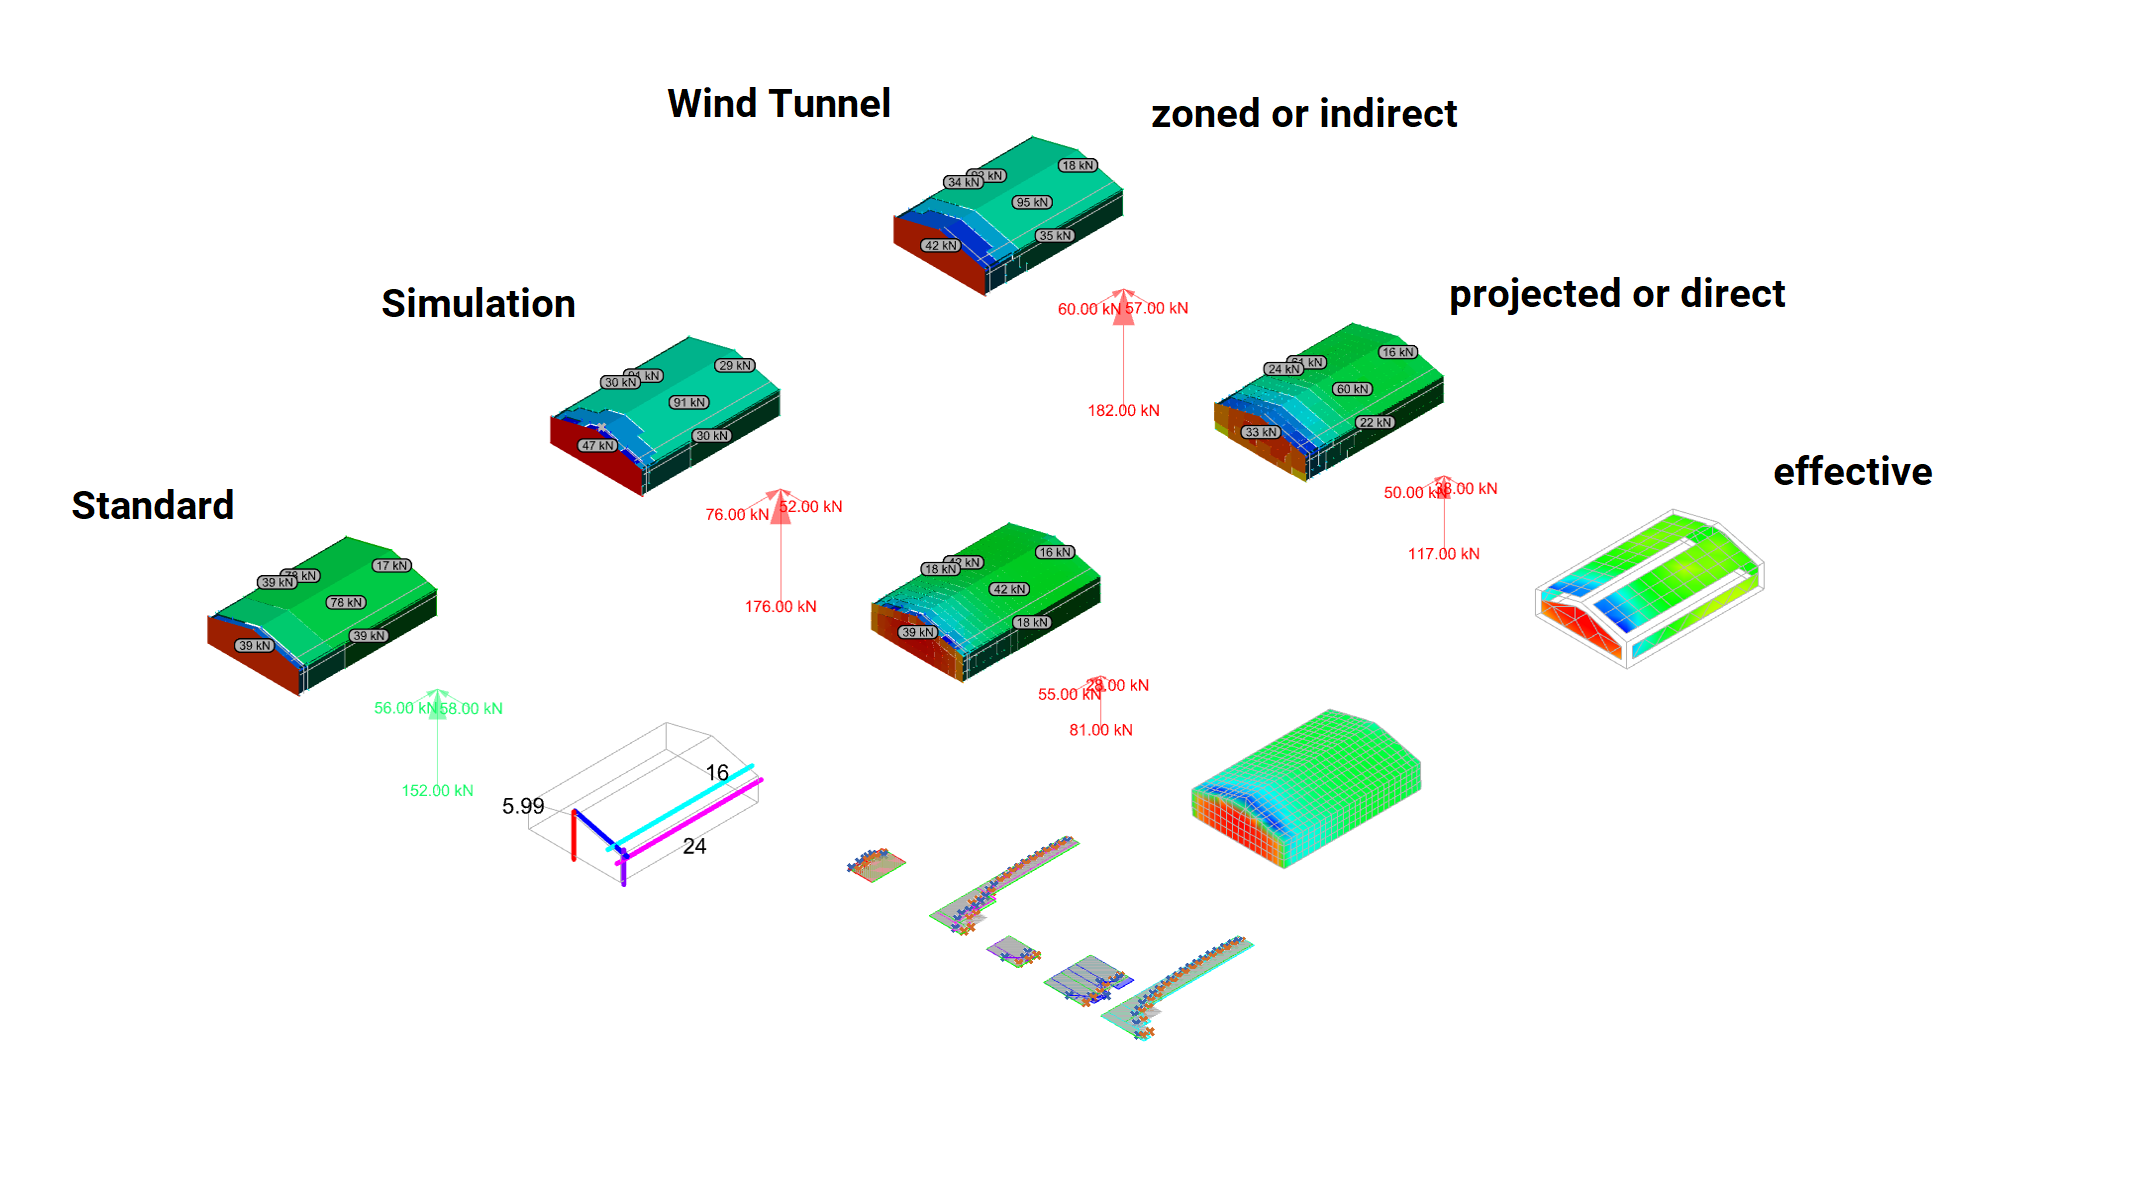
To support the parametric study, a dedicated script was developed to generate results for all three scenarios simultaneously: wind tunnel tests, simulation outputs, and standard-based approaches.

This ensured that all results were obtained using the same set of parameters, some of which were kept constant throughout the study. Meteorological effects —primarily defined by the basic wind velocity and the terrain category based roughness length—were fixed according to the wind tunnel test dataset, producing a default velocity pressure profile as illustrated in the image below.

The mesh size on the structures was varying according to the characteristic zoning dimensions. The refinement factor was chosen so that the resulting calculation domain inlet cell size did not exceed the minimum height, zmin specified by the Eurocode, in order to properly capture the constant section of the wind profile above. For example, a mesh size of 1 meter with a refinement factor of 2 would correspond to an inlet cell size of 4 meter.
Since the primary objective is to minimize the influence of the finite boundaries of the calculation domain—ensuring they are far enough for the pressure to drop to a negligible value— the default domain dimension parameters were 10, 15, 5, and 5 for the windward, leeward, side, and top boundaries, respectively.
The turbulence model used was k-ω, which has proven to be consistent enough during previous investigations. The number of iterations was set to 1000 mainly as a precaution, although the simulations typically converged after only 200–300 iterations, similarly to previous validations.
This procedure instantly produced Eurocode-based zoned wind loads. However, the effective results from the finite volume simulations and the wind tunnel experiments—represented as meshes with vertices corresponding to the original measurement points—required postprocessing. The next step was to project both datasets onto the same finite element mesh. Due to limitations in the wind tunnel measurement points, which are spaced on average about 2 meters apart, some inconsistencies in the results may arise.
The results indicated clear tendencies regarding pressure distribution, which guided the application of Eurocode-inspired zoned load creation. The windward and leeward walls were treated as single zones, with the maximum pressure on each surface applied uniformly across it. The roof and side walls were divided into three zones, corresponding to the Eurocode’s A, B, C and F(G), H, I distribution patterns. This zoning was achieved by dividing the entire range of results for each surface into equal segments and grouping the mesh faces within each segment. The maximum value within each zone was then used as the representative load intensity.

During result extraction, external pressure coefficient values were recorded at specific locations defined by slicing planes through the middle of the windward wall, near the front edge and along the longitudinal edge of the roof and also near the front edge and along the longitudinal edge of a side wall to monitor the decrease in suction along the structure’s height and length.
This setup enabled a consistent comparison across five approaches for every case:
- the direct results of the simulation and wind tunnel, shown as continuous and dashed curves, respectively;
- the zoned or indirect results of the simulation and wind tunnel, represented by solid fill and diagonal hatch patterns;
- and the Eurocode-based results, depicted in green.

Based on the resulting zoned wind surface loads, the global (X – parallel to wind, Y – horizontally perpendicular, Z – vertically perpendicular) and local (separately for each building surface) load resultants were calculated and stored in tables as below for comparison.

Implementation
This parametric methodology allowed the comparison of the average deviations between the simulation results, the Eurocode procedures, and the wind tunnel measurements and monitor standard distribution using histogramms as in image below.

According to these average differences of the results certain default partial safety factor were defined for these categories and these were implemented in FALCON as multiplication factors for wind load intensities.
Default zone numbers were also defined for four typical surface categories: windward wall and leeward wall with 1 zone, respectively roof and side wall surfaces with 3 zones. To adress potential minor value variations a limit value for zone intervals was also introduced.
Since the standard conservatively limits the values for surfaces with decreasing tendencies in suction distribution, such as side walls and roofs, limit values for external pressure coefficients were introduced.

The findings confirmed that CFD simulations, when carefully calibrated with appropriate mesh refinement and boundary conditions, can reproduce the global and local tendencies observed in wind tunnel tests with reasonable accuracy. The comparison also highlighted how partial safety factors can be derived from average deviations between the three approaches, paving the way for a more reliable integration of CFD into everyday structural design practice. The implementation of these findings in the FALCON tool provides engineers with a workflow that balances accuracy, computational efficiency, and compliance with standards.
Ultimately, the study underscores the value of using CFD not as a replacement, but as a complementary method to wind tunnel testing and Eurocode provisions—offering a richer understanding of pressure distributions while ensuring that results remain interpretable and practically applicable in engineering design.