Did you know that bar members can be included in load distribution even when slightly offset from the surface, by using a Load Transfer Surface with a user-defined tolerance?
A Load transfer surface (LTS) is a special type of surface that converts surface loads into line loads and distributes them to structural members. This is particularly useful when surface loads, such as floor loads, snow loads, or wind loads, need to be transferred to supporting members.
In order to use the meteorological load generator function or our fluid-dynamics-based universal wind load generation tool, FALCON, the load transfer surfaces (LTS) on the structure must intersect, they must meet along a common edge. Otherwise, the results will not be accurate.
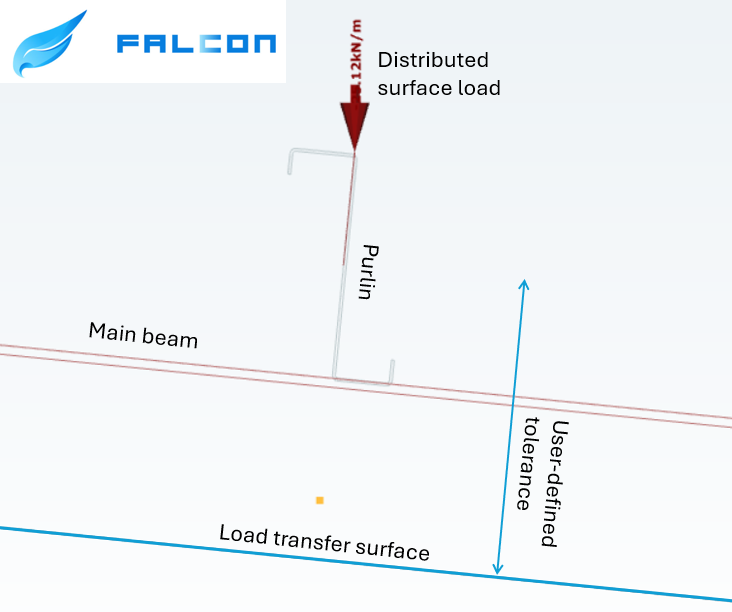
This creates a problem when, for example, the purlins take over the meteorological loads from the sheets or panels, but their planes do not intersect. In this case, the LTS is applied to the plane of the main structure, while the members assigned to it may lie within a specified distance from that plane.
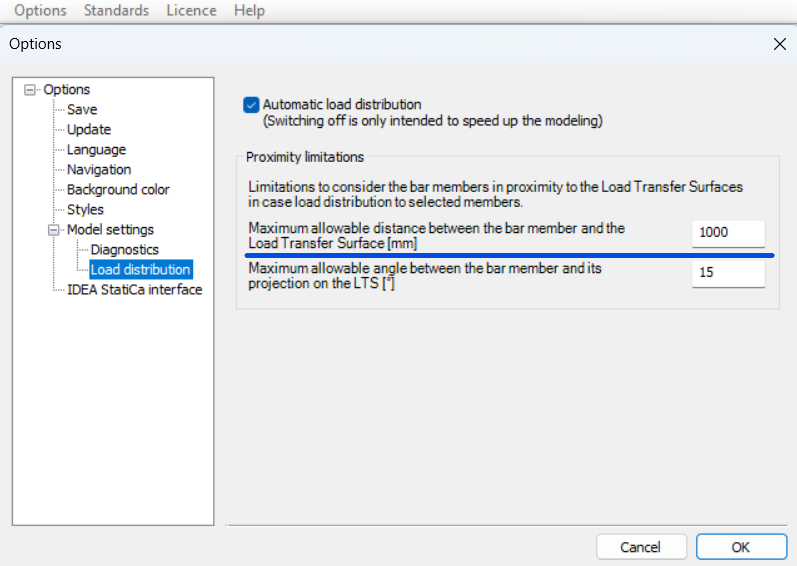
To define the tolerance for the load transfer surface, first go to the Options menu. There, you can set the maximum allowable distance between the bar members and the load transfer surface. In this example, all members that are less than 1000 mm from the surface can be assigned to the load transfer surface.
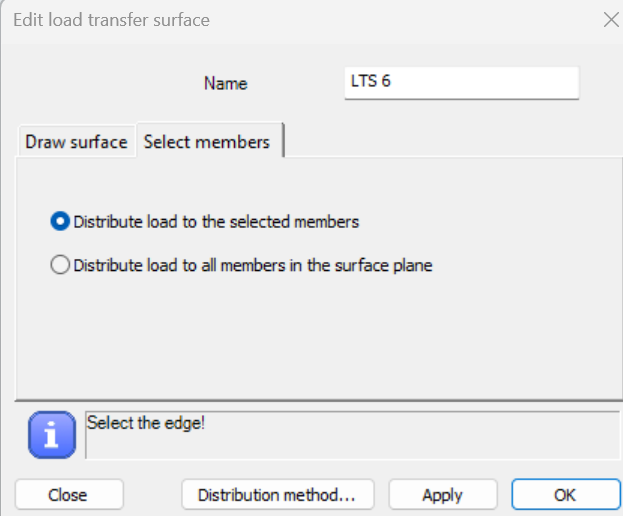
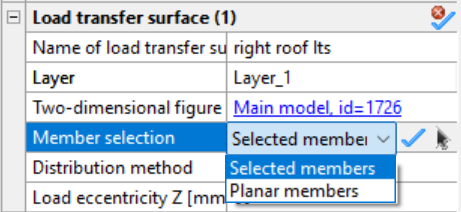
In order to be able to manually select the members attached to the load transfer surface, when defining it, make sure that in the Select members section you choose the Distribute load to the selected members option. If this option was not selected initially, you can set it later by selecting the surface and defining the member selection in the Object Properties window.
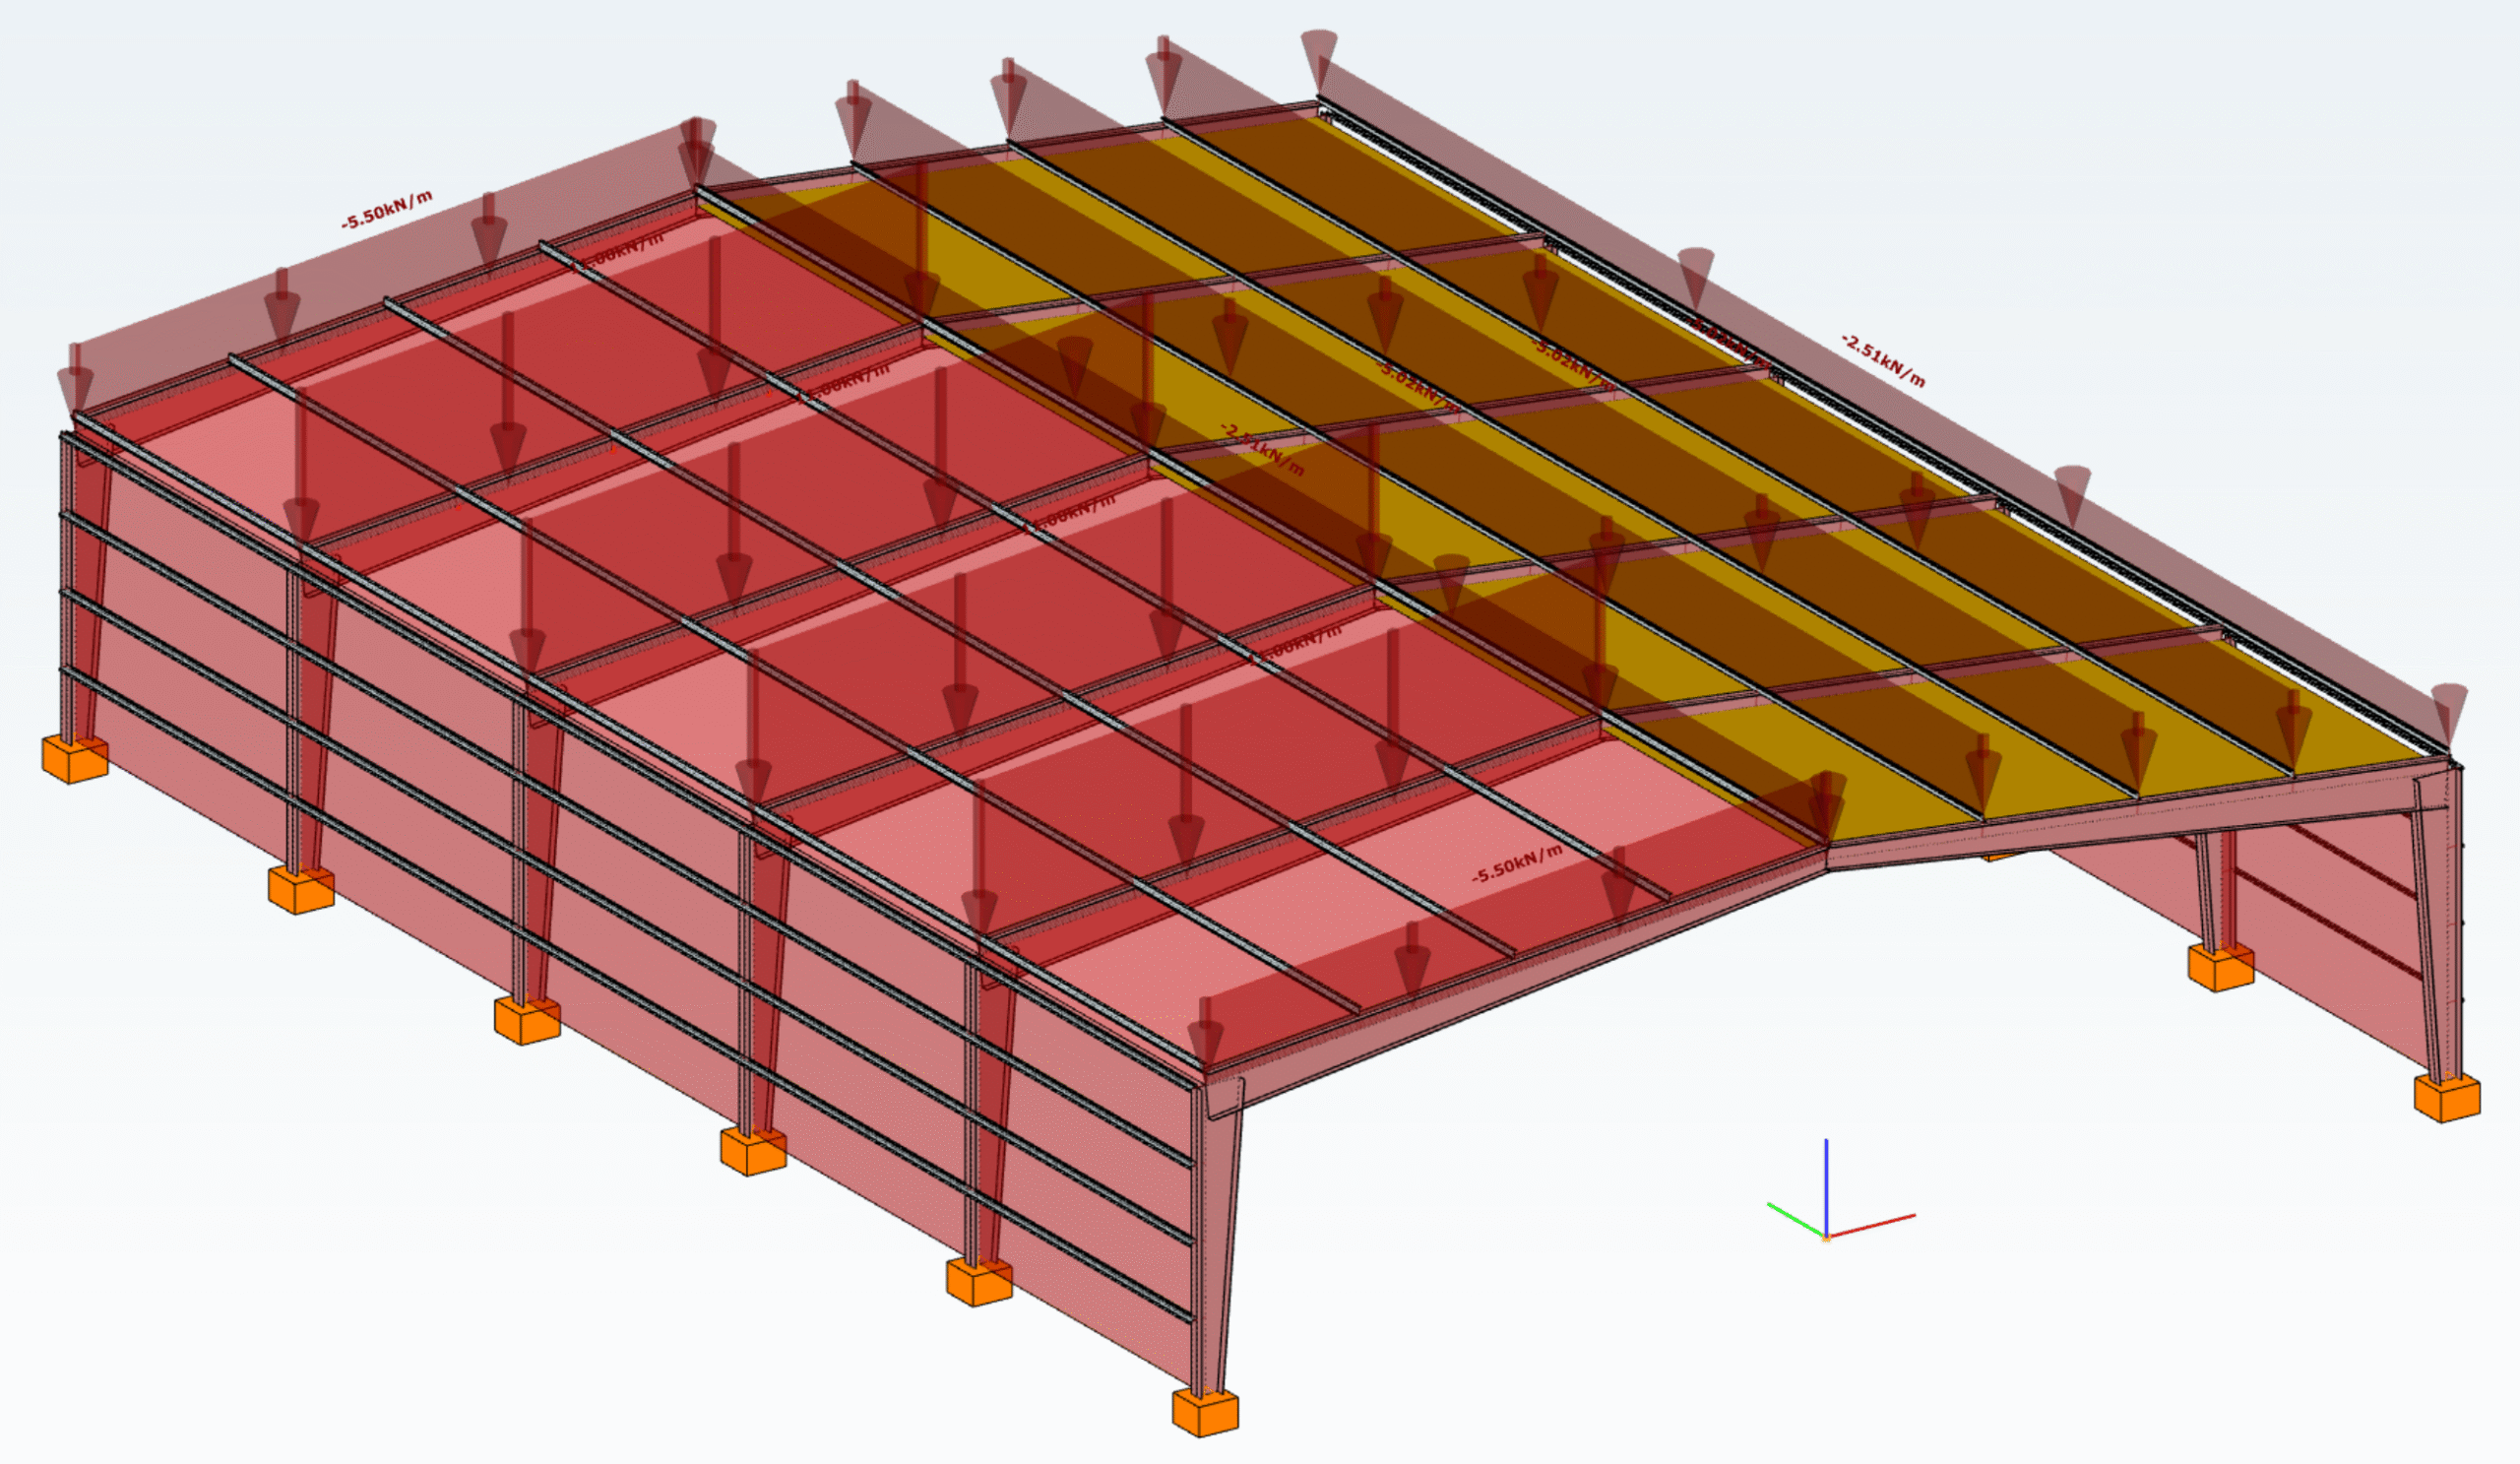
In the example model below, observe how the load distribution changes from the main beams (left side) to the tops of the purlins (right side) by introducing a user-defined tolerance and assigning the appropriate members to receive the load from the roof.
Download the example model and try it!
Download modelIf you haven’t tried Consteel yet, request a trial for free!
Try Consteel for freeFrom now, the new Project Center unites all the functionalities for model and account management, supplemented with easy access to personalized information and learning materials.
gateScripting is a powerful tool to enhance your workflow. We have developed a curated library of Descript examples, Grasshopper scripts, and solutions using the Consteel API to meet various needs and help to speed up your workflow.
gateScripting is a powerful tool in your hand to create, access, and manipulate flexibly model objects and operations or calculations on them. Take a more detailed look into the MyDescript feature, your personal scripting environment in Consteel. Create or add your own scripts or login to your online account and gain access to more scripting solutions from the Script Library.
Scripting is a powerful tool in your hand to create, access, and manipulate flexibly model objects and operations or calculations on them. We know it is not always easy or familiar to the structural engineers, so want to bring the power of scripting closer to you. The Consteel Programming Interfaces cover multilevel scripting options, one of them is the updated internal scripting environment, Descript.
gateCloud solutions can open a new dimension in several services. So we want you to move outside from your computer. As a first step, we make it easy to quickly save, view, access, and open them directly from Consteel.
gatePerfect the understanding of your structure with advanced buckling sensitivity results illustrated on proper mode shape and colored internal force diagrams.
gateCivil engineering software in general use the traditional beam-type deformation representation where the section is shown on the deformation of the reference line. In Consteel 15 we use an advanced method for deformation representation which makes it smooth and realistic. The analysis results are the same, but with the improved visualisation the real 3D behavior of the structure can be better seen.
gateHave you ever tried to visualize the stress distribution of a cross-section from the colored representation? To make it easier for you, we are now introducing Stress diagrams. Watch the video below to learn how to use this feature.
gateGood model and result visualization leads to better understanding and correct interpretation of any data model compared to texts or tables. With the help of Coloring by section feature, you will be able to switch to a new model view where the members get colours from their cross-section type. Watch the feature preview below and learn how to use the Coloring to make your model more perscpicuous.
gate