Part 2 – Imperfection factors
The Eurocode EN 1993-1-1 offers basically two methods for the buckling verification of members:
(1) based on buckling reduction factors (buckling curves) and
(2) based on equivalent geometrical imperfections.
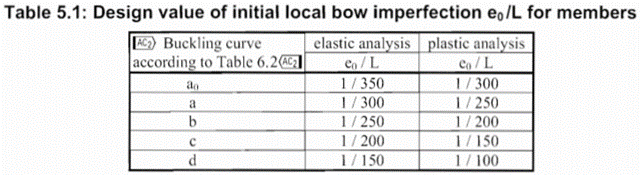
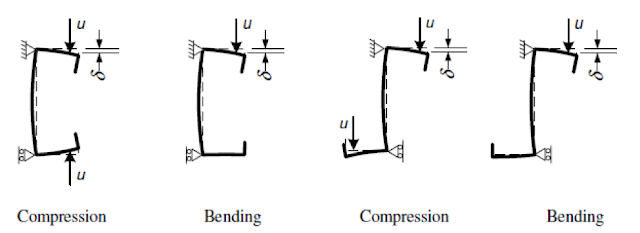
In the first part of this article, we reviewed the utilization difference and showed the relationship between the two methods. It was concluded that the method of chapters 6.3.1 (reduction factor) and 5.3.2 (11) (buckling mode based equivalent imperfection) are consistent at the load level equal to the buckling resistance of the member, so when the member utilization is 100%. The basic result of the procedure in 5.3.2 (11) is the amplitude (largest deflection value) of the equivalent geometrical imperfection. However, the Eurocode gives another simpler alternative for the calculation of this amplitude for compressed members in section 5.3.2(3) b) in Table 5.1, where the amplitude of an initial bow is defined as a portion of the member length for each buckling curves (Fig. 1.). We use the first column (“elastic analysis”) including smaller amplitude values.
It is an obvious expectation that these two standard procedures should yield at least similar results for the same problem. However, this is by far not the case in general.
In order to show the significance of the imperfection amplitudes this part is dealing with these two calculation methods, the variation of their values and the effect on the buckling utilization.
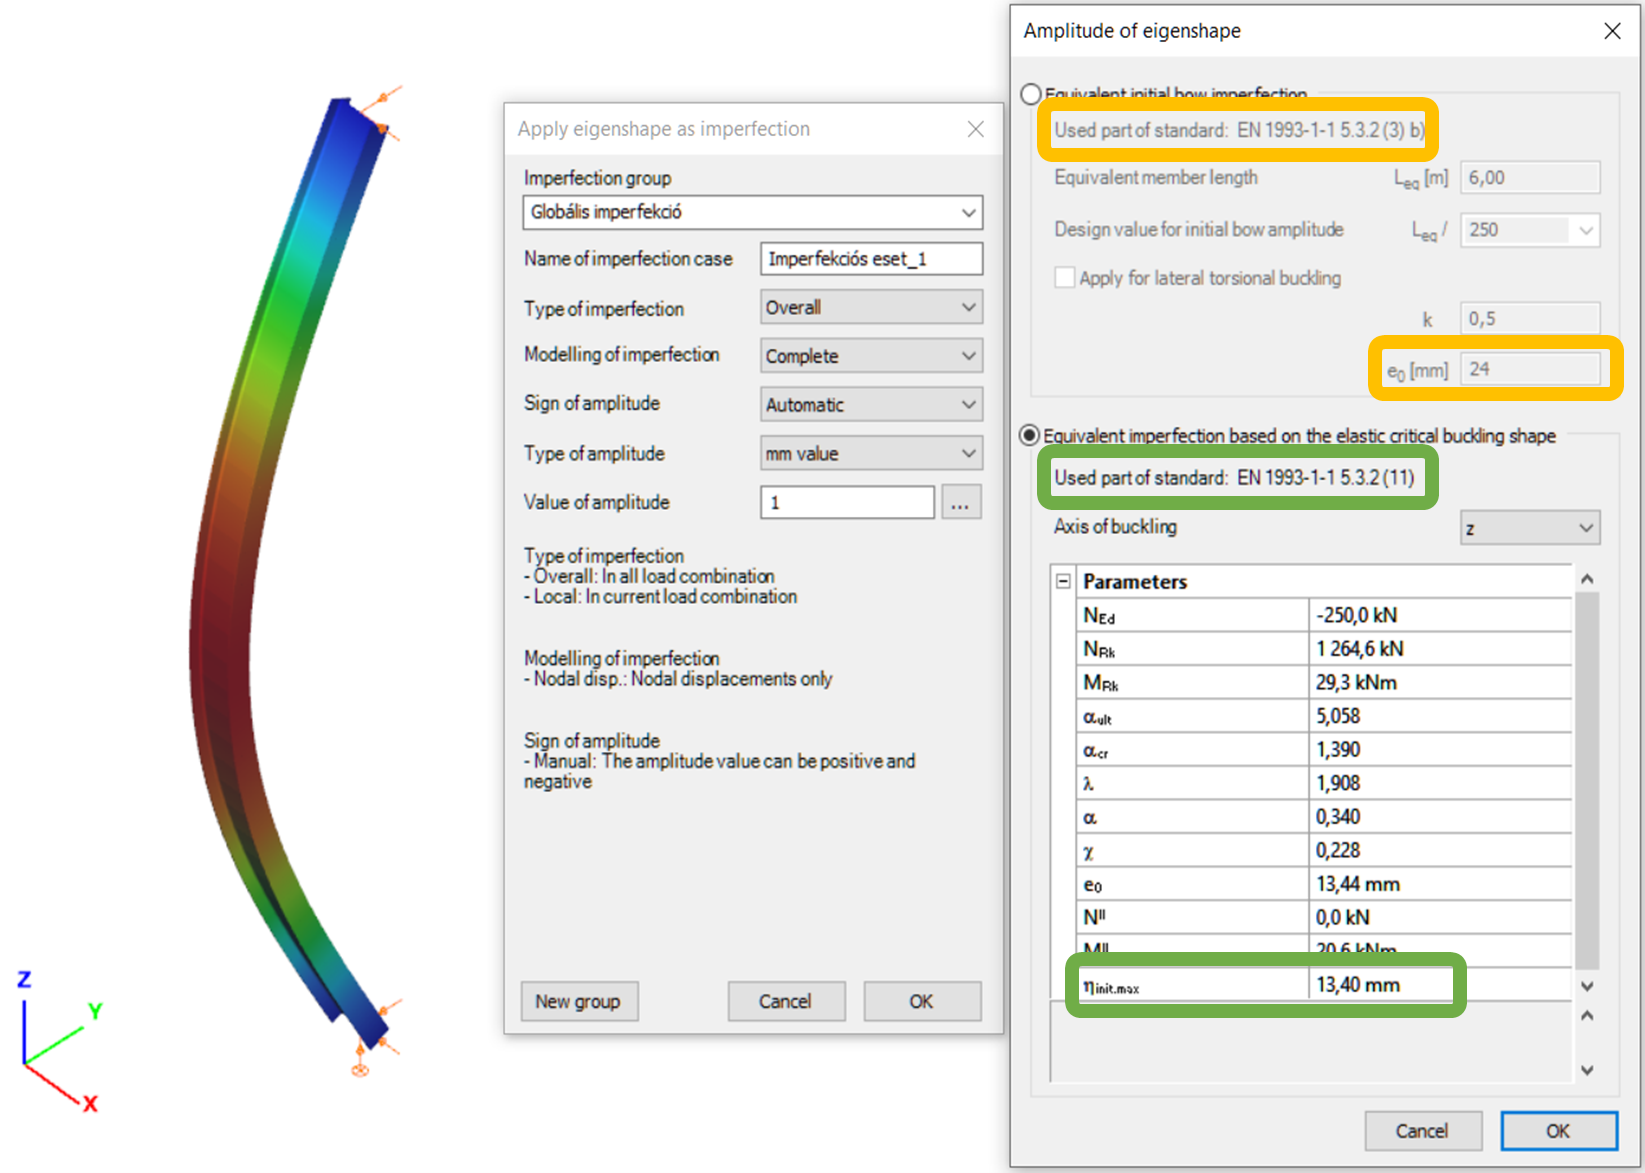
Let’s see again the simple example of Part 1: a simply supported, compressed column with a Class 2 cross-section (plastic resistance calculation allowed). The column is 6 meters high and has an IPE300 cross-section made of S235 steel. The two methods are implemented into Consteel and on Figure 2. it can be seen, that the two values for the amplitude of the geometrical imperfection is very different – e0 = 24 mm by the 5.3.2(3) b) Table 5.1 (L/250) and e0 = 13,4 mm by the 5.3.2 (11) (same as in Part 1).
Modeling of tapered elements
Stability calculation of tapered members is always a difficult problem despite its popularity in steel hall construction.
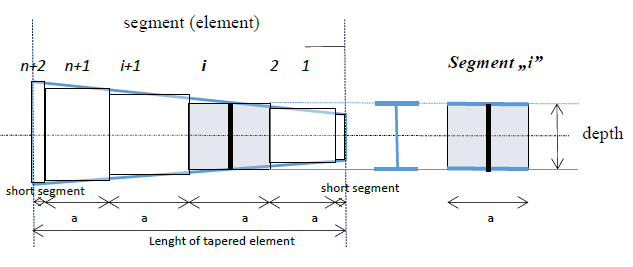
Generally in analysis software for the stability analysis a segmented but uniform beam element method is used where a member with I or H cross section and with variable web depth is divided into n segments and the depth of each segment is taken equal to the real depth measured at the middle of the segment. The lengths of the segments were taken equal, except at both ends where additional shorter segments are added in order the better approximate the real depth of the elements to be modeled. Such model captures correctly the in-plane displacements, but cannot consider accurately the additional torsion coming from the axial stresses due to warping in the flanges which are not parallel with the reference line in case of tapered elements.
This simplification may cause incorrect results in calculating buckling modes involving torsional displacements like flexural-torsional buckling of columns or lateral-torsional buckling of beams especially in cases where the beam flanges have longer unbraced lengths.
Consteel analysis model for tapered members
In order to improve the accuracy of the stability analysis of structural models including tapered members Consteel uses a special tapered beam finite element. A basics of this unique finite element have already been published by other researchers however up to now Consteel is the only commercial software which has implemented this finite element for the buckling analysis.
The mentioned problems arising from the non-parallel flanges can be fixed by considering appropriate additional terms in the element stiffness matrix. The final stiffness matrix can be written as a sum of original stiffness matrix and the additional terms:
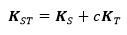
Where KS is for the original stiffness matrix with uniform cross section and KT contains the additional terms valid for doublesymmetric and monosymmetric I and H cross sections.
The additional terms in KT use the following special cross section parameters:
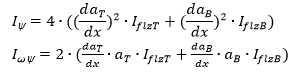
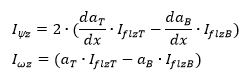
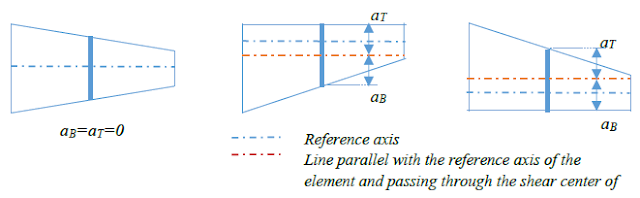
Where IflzT and IflzB are the intertias of the flange related to z axis (parallel to the web), for upper (T) and bottom (B) flanges, respectively, aT and aB is the distance between the centerline of upper and lower flange and the line parallel with the reference axis of the element and passing through the shear center of the middle cross section, as seen on the picture below in case of double symmetric I and H cross section.
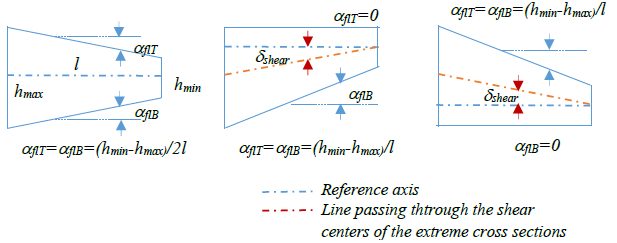
Additionally daT/dx and daB/dx means the angle between the upper and lower flanges and the line parallel with the reference line of the element and passing through the shear center of the middle cross section, respectively. As an approximation these can be expressed as:

where aflT and aflB are the angles between the flanges and the element reference line, ẟshear is the angle between the lines passing through the centers of gravity and shear centers of the extreme cross sections of the elements.
Comparison of results
This part shows some validation examples for the accuracy of the implemented new finite element compared to published numerical results and analysis by shell elements. The examples show the very high accuracy of this element even in the most challenging buckling cases where the segmented uniform beam element method yields some extent of inaccuracy.
gateEN 1993-1-3 contains 3 „secret” formulas. The first two are used to determine the effective cross section due to distortional buckling when edge or intermediate stiffeners are involved. The third is used to calculate the distortion of the whole cross section when analyzed with a connected sheeting.
The physical meaning of all three formulas can be easily shown with simple ConSteel models which helps designer to understand the underlaying mechanial model.


The first formula (5.10) is used when the ability of an edge stiffener to stabilize a compressed flange of Z or C section is studied. During distortional buckling the intersection point of flange with the lip (it is called as edge stiffener) is expected to move in a direction perpendicular to the flange. This formula gives the stiffness value provided by the Z or C section, when is assumed that during deformations the point of intersection of the web with the flange doesn’t move. This assumption corresponds to attaching supports to these nodes as seen on picture 5.6 of EN 1993-1-3.
When a compressed edge stiffener would buckle, it will be partially restrained by the section with these attached supports. Depending on the distribution of normal stresses on the section, one or two edge stiffeners might be under compression. If both stiffeners are under compression and tend to buckle, the restraining capacity of the section will have to be shared between them. This sharing requirement is reflected by the coefficent kf. The spring stiffness value will be used as a distributed spring support when the buckling resistance of the edge stiffener is calculated.
Stiffness values are typically calculated as the ratio of a displacements obtained from the application of a unit load. In this case the unit loads are applied parallelly to the expected displacement of the compressed edge stiffeners.
The ConSteel model shown below reproduces the stiffness calculation for a 1 m long Zee section (as a simplification the unit loads are placed at the intersection of the flange with the lip and not at the center of the gravity of the edge zone):
Z purlin, nominal thickness = 1.30 mm, 200 mm deep, 72 mm wide symmetric flanges, 15.5 mm deep lips
in case of My bending: kf = 0, b1 = b2 = 72 mm, hw = 198.7 mm, t = 1.26 mm
K1 = 210000*1.26^3/4*(1-0.3^2)*1/(72^2*198.7+72^3+0.5*72*72*198.7*1.0) = 0.08 N/mm2
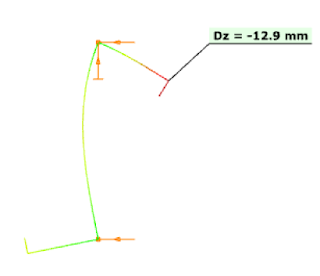
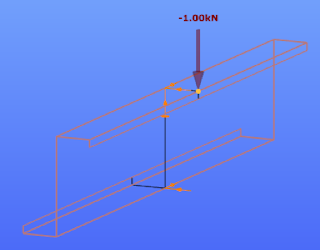
The resulting vertical displacement from the point load is 12.9 mm.
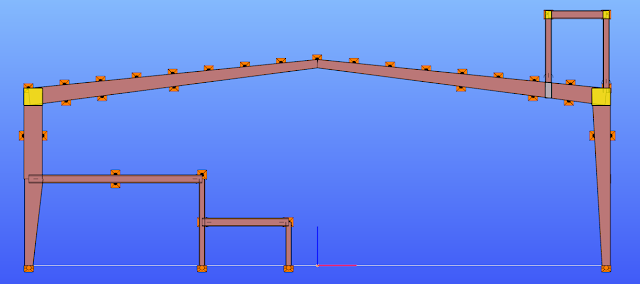
gateIn everyday practice frames of pre-engineered metal buildings are often designed as 2D structures. Industrial buildings often have partial mezzanine floors, attached to one of the main columns, to suit the technology. Additionally, such buildings often have above the roof platforms for machineries.
When it comes to seismic design, as long as seismicity is not deemed to be a strongly controlling factor for final design, the mezzanines are just attached to the same type of frames as used at other non-seismic locations and are locally strengthened, if necessary. Only the horizontal component of the seismic effect is considered in most of the cases.
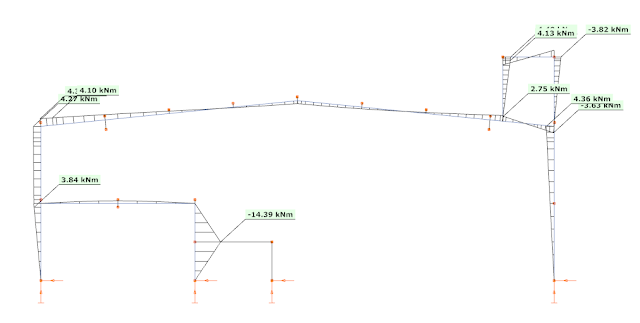
The following picture shows a typical intermediate frame of a longer industrial hall, with built-in partial mezzanine floor and with a platform placed above the roof.
Equivalent Lateral Force method
The most straightforward design approach is the Equivalent Lateral Force (ELF) method (EN 1998-1 4.3.2.2). There are certain conditions for the application of this method.
- (1)P. this method may be applied to buildings whose response is not significantly affected by contributions from modes of vibration higher than the fundamental mode in each principal direction
- (2) the requirement in (1)P is deemed to be satisfied in buildings which fulfill both of the following conditions
o they have a fundamental period of vibration smaller than the followings
4*Tc or 2.0 sec
o they meet the criteria for regularity in elevation given in 4.2.3.3
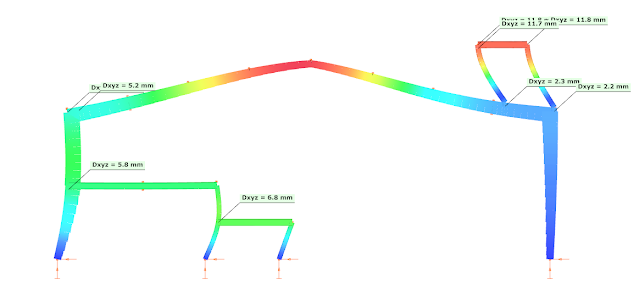
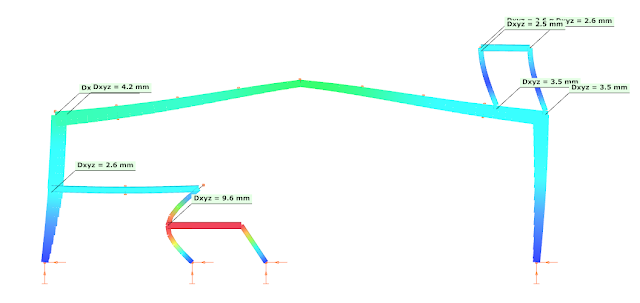
When a dynamic analysis is performed on this 2D frame, the following vibration modes are obtained:
The first condition is met, but the criteria for the regularity in elevation is difficult to be judged. The first condition of 4.2.3.3(2) is met, but 4.2.3.3(3) is not really, as the mass is not decreasing gradually from foundation to the top, because of the heavily loaded above the roof platform.
Let us disregard for a moment this second criteria and accept the ELF method.
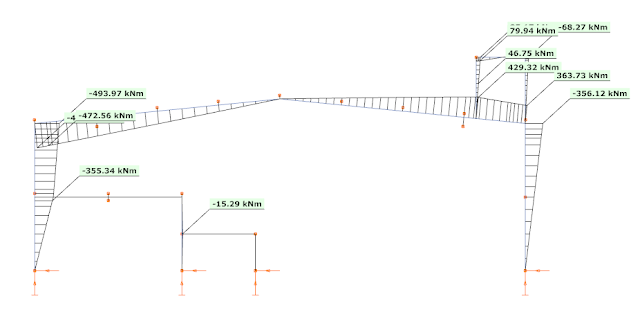
When the ELF method is applied, only the first (fundamental) mode is used, with the total seismic mass of the building carried by this frame. As the seismic effect is described with one single fundamental vibration mode only, the representation of the seismic effect is a simple equivalent load case, called as dominant load. Using this regular load case all the common first and second-order analysis can be performed, as also the linear buckling analysis. For example, the bending moment diagram calculated from the dominant mode (from left to right) is the following:
This way Consteel can perform an automatic strength and stability verification for the seismic combinations. The results are visible here, respectively:
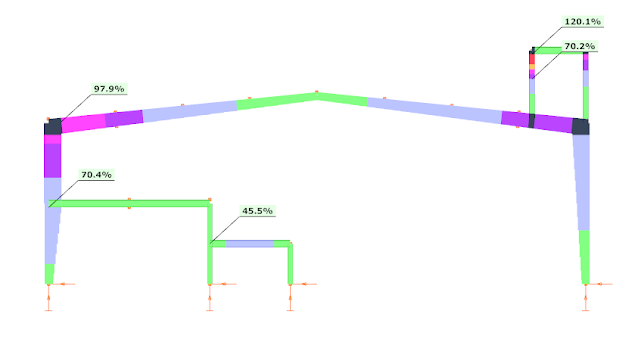
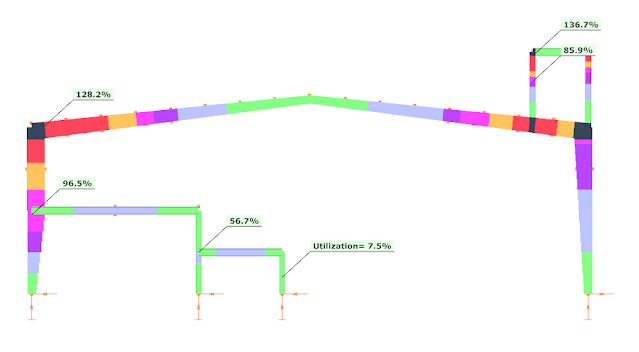
As it can be seen the structure is generally OK for strength, but there are some local overstresses at the platform and the utilization ratio is very high at the left corner. Regarding stability verifications the section seem to be weak. So – as expected – it is a key importance to be able to perform the stability verifications.
Of course, the platform column could be strengthened and close this exercise. But somebody can still have some doubts about the applicability of this ELF method, due to the criteria of vertical regularity.
Modal Response Spectrum Analysis
How could this structure be more precisely calculated? The general approach proposed by EN 1998 is the Modal Response Spectrum Analysis (MRSA) (EN 1998-1 4.3.3.3). This method is applicable in all cases, where the fundamental mode of vibration alone does not describe adequately the dynamic response of the structure. MRSA will take into account all the calculated vibration modes, not only the fundamental and therefore the precise seismic effect can be worked out on the structure. But the main problem is that this will result an envelope of the maximum values of internal forces and displacements, without any guarantee that these correspond to the same time frame of the seismic action. Plus, the internal forces produced at ends of members connected to a given node are not even in static equilibrium…. And even the sign of the internal forces or deformations is only positive due to the use of modal combinations SRSS or CQC. And even worse, as the seismic action calculated this way cannot be described by a single load case or by a linear combination of multiple load cases, no linear buckling analysis can be performed and therefore the automatic buckling feature of CosSteel cannot be used.
Let us see what MRSA with a CQC combination would give.
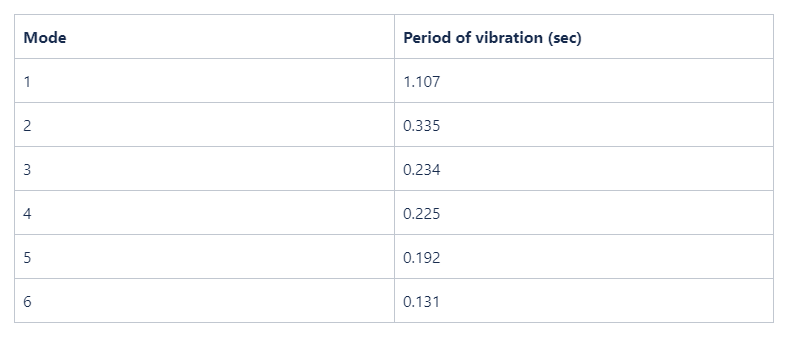
The first 7 vibration modes with the corresponding seismic mass participation values can be seen in the next table. The first column shows the frequencies in Hz and the second column shows the mass contribution factors in the horizontal direction. The other columns mean the mass participation in the other directions (out-of-plane and vertical), but these are not important for our example.
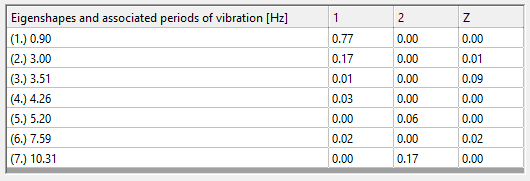
EN 1998 requires to consider enough vibration modes in each direction to reach a minimum of 90% of the seismic mass.
With Consteel the first 7 vibration modes have been calcualated and the results are shown in the table. Direction ‘1′ means horizontal in-plane direction while ‘2’ means horizontal out-of-plane direction and ‘z’ means the vertical direction. We are concentrating now on the vibrations which happen in the plane of this frame.
As visible, the fundamental mode has high contribution (77%) but does not reach the required level. The difference may justify the initial doubts about only using this single mode and disregard all the others. To fulfill the 90% minimum criteria, the second mode (17%) must be also considered, but visible even the 4th and the 6th have non-zero (although less then 5%) contributions in this direction.
As said before Consteel can perform only strength verifications but no stability verifications based on results obtained from an MRSA combined with CQC modal combination rule.
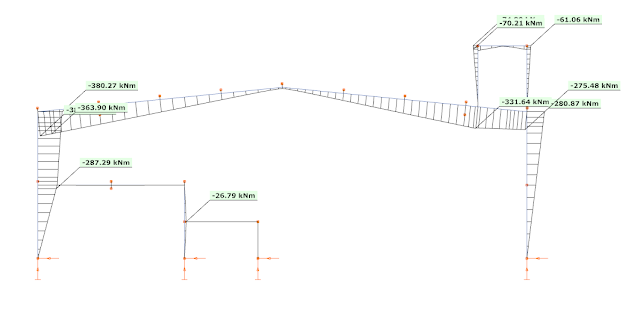
The bending moment diagram with the maximum possible values looks as shown below (all the bending moment values from the multimodal result are without a sign, they must be assumed as positive and negative values as well):
The results of the strength verification are the following:
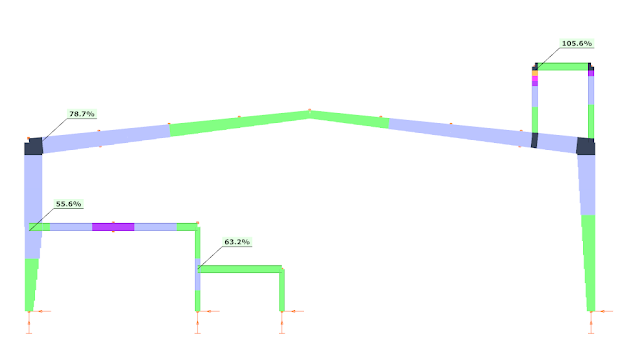
As visible the platform leg is still weak, it must be strengthened without a question. On other hand the utilization ratio (without stability verification!!) at the left corner is lower, therefore there is a chance the the ELF-based 97.9% strength verification result could be still acceptable as safe, but the stability must be checked somehow.
But it is also visible, that generally the bending moments obtained by MRSA CQC are much lower than those obtained with the ELF method. Why is this? And how can a stability verification be performed?
Consteel approach
Seismic modal analysis with “selected modes”
Luckily Consteel provides a very flexible approach, called as „selected modes” method. This allows the user to pick the vibration modes and create linear combinations from them by specifying appropriate weighting factors. As a result, a linear combination of the modal loads calculated from vibration modes is obtained, instead of the quadratic SRSS or CQC combinations, which can be considered already as a single equivalent load case and all the necessary first- and second-order static and linear buckling analysis can be performed, as in the case of ELF calculation.
The definition of the „selected modes” and the specification of weighting factor is not an automated process in Consteel, it must be driven by the user. To be successful, it is important to understand how the structure works.
Although the first 2 vibration modes together already fulfill the minimum 90% mass contribution requirement, let us see the additionally also the 4th mode:
1st mode f=0.90 Hz, T=1.109 sec
2nd mode f=3.00 Hz, T=0.334 sec
4th mode f=4.265 Hz, T=0.234 sec
The colors suggest that the fundamental mode describes globally the structure, but the second seems to affect additionally the platform region and the 2nd or 4th is dominant for the mezzanine structure.
The corresponding bending moment diagrams are, respectively:
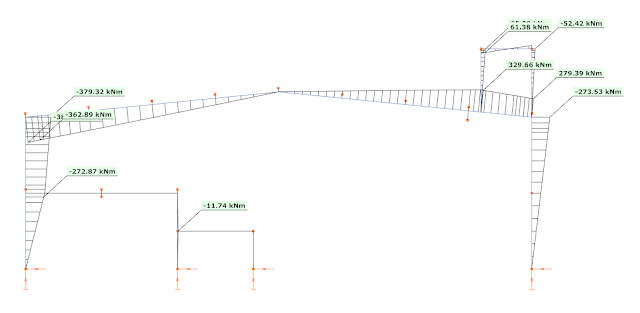
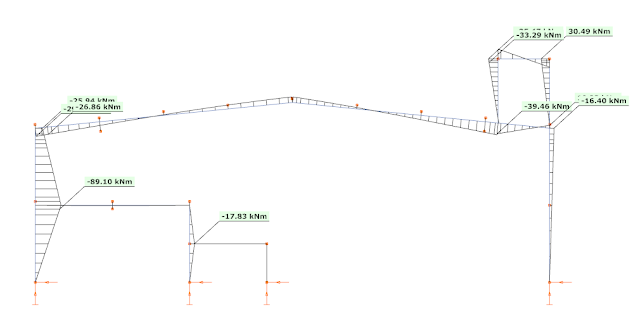
These bending moments also justify the assumption made based on the colors, the 2nd mode creates significant bending moments additionally to the first mode and the 4th mode creates significant bending moments additionally to the 1st mode. But it seems that also the 2nd mode created significant bending moments at this region.
It is interesting to note, that the bending moment diagram from the 1st mode (picture 9) almost perfectly fits to the CQC summarized bending moment (of course by assigning signs to the values based on the fundamental vibration mode) (see picture 4), except in the regions of the platform and the mezzanine. This means that in general the fundamental vibration modes describes quite well the dynamic response of this frame. And because of this, the bending moments could be calculated with the mass contribution factor corresponding to this mode (77%). And this is the reason, why the ELF method gives higher bending moment values, as there the same vibration mode was considered, but instead of the corresponding mass (77%), with 100% of the seismic mass.
As we discovered, the 2nd mode should be used together with the 1st mode to correctly describe the platform region, as this region is not fully dominated by the 1st mode only, the 2nd has a significant contribution.
Similarly to the mezzanine region, additionally to the 1st mode, here the 4th mode must be used to better approach the correct result.
gateIt is known that the lateral torsional buckling resistance of a simple supported beam can be significantly increased if its compressed flange is connected adequately to a trapezoidal decking.
Eurocode allows to consider the compressed flange as fully restrained laterally, if the following condition is met (EN 1993-1-1 BB2.):
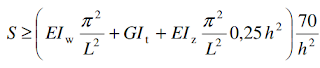
If the condition is not met, Eurocode doesn’t provide too much guidance how the contribution of a less rigid sheeting can be considered.
The following graph shows the effect of shear stiffness on the ultimate load capacity of a 10 m long simple supported IPE purlin loaded at the level of the top flange. It is assumed that several of these purlins are uses with 3 meters of distance between their centers.
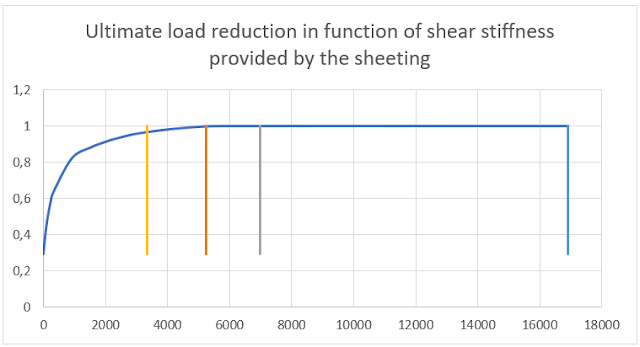
The blue line in the graph shows the ultimate load carried by this purlin, in function of the actual shear stiffness. Shear stiffness of the sheeting measured by “S” is shown on the horizonal axis and a reduction factor applied on the plastic moment resistances is shown on the vertical axis.
The graph has been built with the help of Consteel software, using 7DOF beam finite elements. Such beam elements are adequate to consider the presence of any shear restraint.
In case of S=0, the value is calculated without any contribution. By increasing the shear stiffness the line approaches the maximum value of 1, when no reduction of the plastic moment resistance due to lateral torsional buckling is required. In other words when lateral buckling checks can be disregarded.
gate