Introduction of Consteel Superbeam
In general, Consteel uses 7 DOF beam elements for finite element analysis of steel structures which are adequate for most everyday design situations. It is also capable of using shell elements in order to get more precise results in cases where beam finite elements are not sufficient enough. With the new Superbeam function it is now possible to examine structural parts with the accuracy of shell elements but with the ease of using a beam element concerning definition, modification, model handling, etc. In practice, it means that 7DOF beams can be switched to shell elements (and back) at any stage of the design process.
Validation
The validation program aims to verify the full mechanical behavior of the Superbeam switched to and analyzed as shell elements within a structural model composed of 7DOF beam elements. The validation of the analysis of the shell finite elements was done before and it is clear that in the case of correctly set boundary conditions the results are the same as the beam model provided that the local web buckling effect is avoided because it can not be modeled with beam-theory. Therefore the accuracy of the mechanical behavior of the Superbeam basically depends on two major factors:
- 1. the automatic shell modeling and mesh of the Superbeam
- When transforming a beam model in the structural analysis to shell model, several automatic transformations are done with the model objects (loads, supports, connected elements etc.) in order to yield a consistent mechanical model.
- 2. the mechanical consistency of the connections of Superbeam at the boundary to 7DOF nodes
- To satisfy the mechanical consistency at the connecting nodes the Superbeam uses automatically set constraint elements at both ends. They ensure the compatibility of the complete displacement field (translations, rotations, and warping) with the adjacent 7DOF beam finite element node or with the 7DOF point support.
The validation studies prove that the beam analysis model is mechanically equivalent to the shell analysis model within the Superbeam by comparing the results of the two models. It is shown that
- in the case of models where the local plate-like specific behavior is not relevant (thick plates in the cross-secions) the results are the same
- in the case of models where the local plate-like specific behavior is relevant (thin plates in the cross-secions) the results can be different only because of this plate-like behavior (local buckling, cross-section distortion) while the isolated beam-like behavior is the same
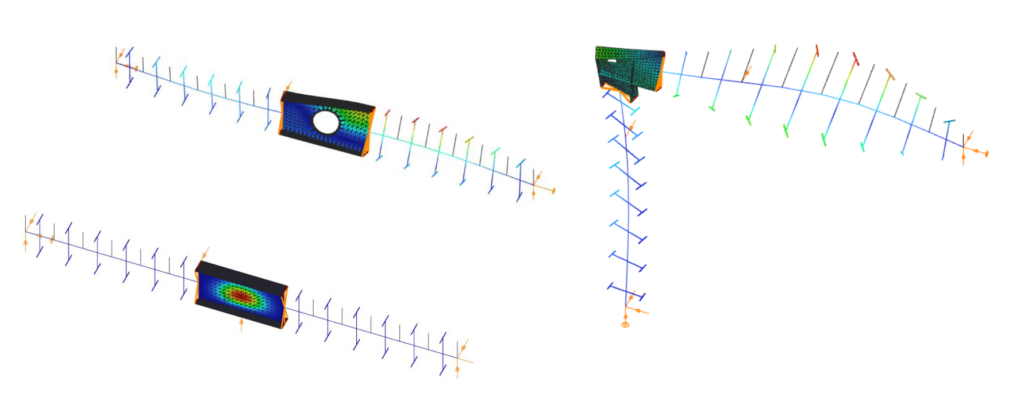
Part 1
In this first part of the validation, we examined simply supported beams of welded I-sections with several different profile geometries. The full length of the beams was changed to Superbeam shell and so the consistency of results of both the shell elements and the constraints could be analyzed.
Structural models and analysis
In every case, the beam was first calculated with 7 DOF beam finite elements, after with Superbeam shell elements, and finally also as a full shell model with the same finite element sizes as the Superbeam shell. In full shell models, we applied rigid bodies along the edge of the web.
Linear buckling analysis was executed in order to compare the first buckling eigenvalues.
Our expectation was that the two kinds of shell models would produce very similar results which are by nature somewhat less favorable than the 7 DOF beam results, meaning that alfa critical values should be lower when using shell elements. To be able to compare the results related to global (lateral-torsional) buckling, the effect of local buckling of the web was to be avoided as much as possible so the examples were chosen accordingly.
Geometry
Loading
gateIntroduction
Beam with welded I sections are often executed with slender webs. This is mainly due to the recognition that the main contributors to bending stiffness of a beam are the flanges. The web plate’s main role is to safely keep these flanges away from each other and carry the shear stresses which might be present. Significant weight saving can be achieved with the use of slender webs, but there are some aspects to take care about.
When slender web plates are exposed to longitudinal, uniform normal stresses, above a certain stress level its distribution will no longer remain uniform. A compressed region of a plate distant from its lateral supports may buckle in a direction perpendicular to the acting external normal stresses, causing a subsequent transfer of stresses from the affected region to other neighbouring regions remaining in their unbuckled position.
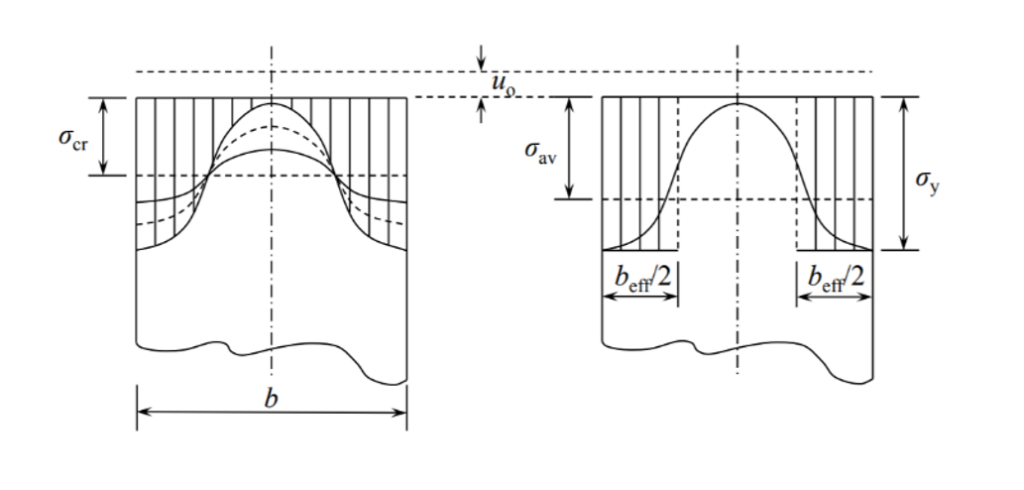
This buckling remains limited to a part of the plate keeping other parts intact and therefore is called as local buckling. Local buckling usually does not result an immediate collapse of the structure, due to possibility of the stresses to redistribute and often even a substantial amount of further load increases are possible.
The tendency of a compressed plate to suffer local buckling is characterized by its slenderness value defined by the following formula
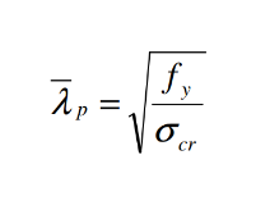
where σcr is the critical stress level above of which the stress redistribution and local buckling starts to appear. A higher critical stress will result in lower slenderness value which indicates that the plate can carry higher compressive stresses without the initiation of local buckling.
Analysis of cross-sections with beam finite elements
The well-known beam finite elements used by usual structural design software do not “see” the internal composition of the cross-section. During structural analysis the sections are represented by certain integrated cross-sections properties assuming the validity of several assumptions including the Bernoulli-Navier Hypothesis and the non-deformability of the cross-section. A local buckling of any of its internal plates would violate these assumptions making hard to create the equivalent cross-sections properties.
In the modern design practice followed by Eurocode the phenomenon of local buckling is handled by the use of effective section properties. Regions subject to possible local buckling of compressed plates of a cross-sections are “eliminated” and the section properties are calculated based on the remaining parts of the cross-sections.
Design verifications use these effective cross-section properties to calculate the resistance of cross-sections exposed compressive forces. When required by Eurocode, the effect of appearance of local buckling can also be reflected in a structural analysis using beam finite elements with the use of effective cross-section properties, instead of the original gross section properties. This is mainly required to prove serviceability criteria.
Analysis of cross-sections with Consteel Superbeam
The Consteel Superbeam function makes possible to confirm directly the presence of local buckling using the same beam element based model, but using a mixed beam and shell finite element modelling and analysis approach. Using the Superbeam tool, complete structural members or parts of them can be alternatively modelled with shell elements and the rest can still be modelled with beam finite elements. Using this technique, the total degrees of freedom of the model can be kept as low as possible. When using Superbeam, the designer has the choice whether to use beam or shell finite elements, as appropriate.
Contrary to beam finite elements, modelling with shell finite elements doesn’t have the previously mentioned limitations. This approach can fully consider the shape and location of the cross-section’s internal components instead of the use of an integrated overall section property. When a linear buckling analysis (LBA) is performed, the critical stress multipliers corresponding to the actual stress distribution can be obtained. Additionally to the load multipliers, the corresponding buckling shapes are also available, giving direct indication on the location, shape and appearance of local buckling within the compressed parts of the cross-section.
The use of effective cross-section concept is very convenient but there might be cases when more insight view is desired. The following example gives an idea where the Superbeam function can be helpful.
Demonstrative example
Let’s consider a 12 m long simple supported welded beam with the following parameters
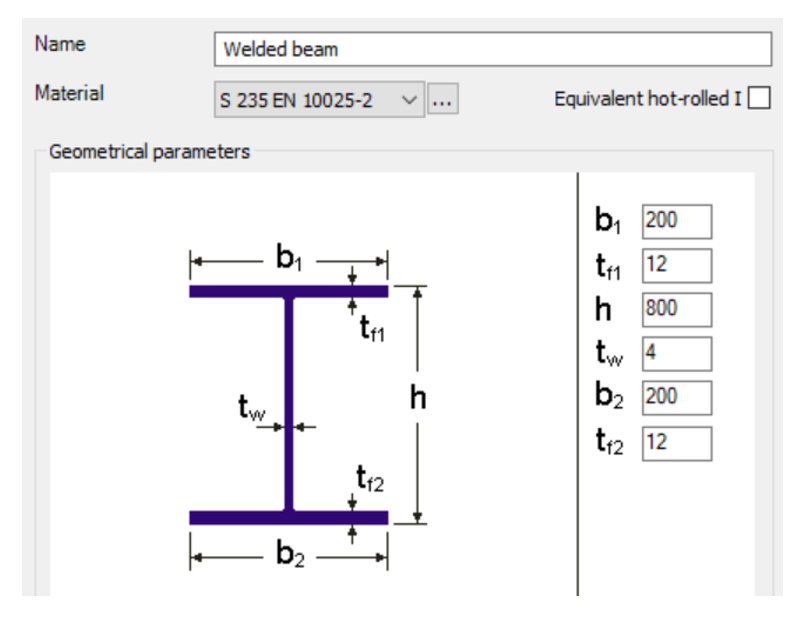
The beam is laterally restrained at third points at the level of its upper flange. The beam is loaded with its self-weight plus a uniformly distributed load of 10 kN/m acting at the level of upper flange.
When the beam is analysed with 7DOF beam finite elements, one can obtain the critical load multiplier of 5.2 of the global buckling mode, which is lateral-torsional buckling (LTB) in this case.
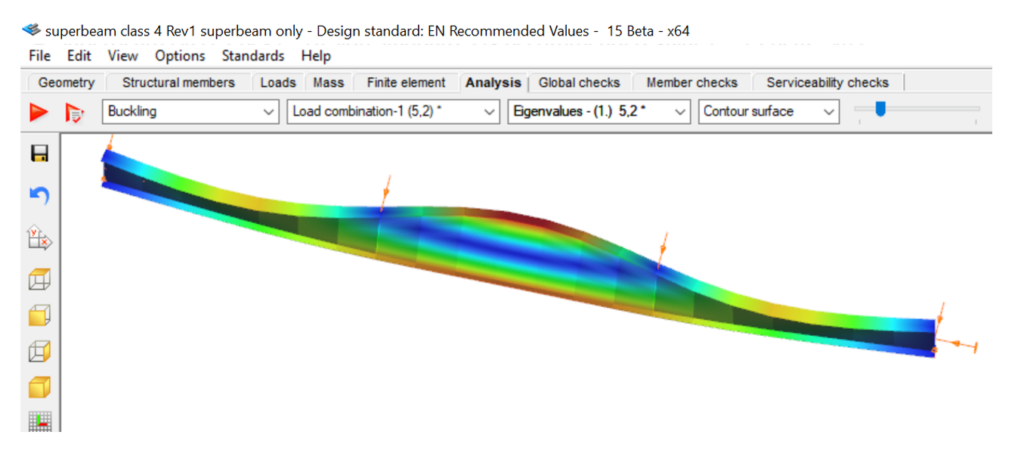
The beam finite element cannot give any visible indication about possible local buckling in compressed plates of the cross-sections.
As the maximum bending moment occurs in the middle third of this beam, it seems enough to analyse this part mode deeply with the Superbeam function. An LBA with the mixed beam and shell model gives comparable critical multiplier of 5.22 with some numeric perturbances in the part modelled with shell elements.
gateTheoretical background
According to the beam-column theory, two types of torsional effects exist.
Saint-Venant torsional component
Some closed thin-walled cross-sections produce only uniform St. Venant torsion if subjected to torsion. For these, only shear stress τt occurs.
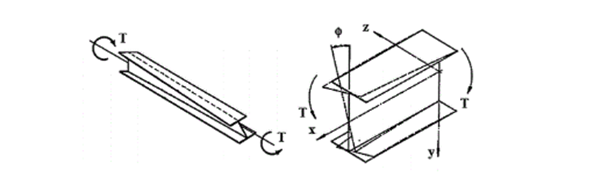
The non-uniform torsional component
Open cross-sections might produce also normal stresses as a result of torsion.[1.]
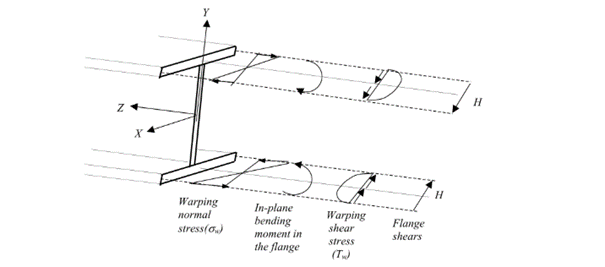
Warping causes in-plane bending moments in the flanges. From the bending moment arise both shear and normal stresses as it can be seen in Fig. 2 above.
Discrete warping restraint
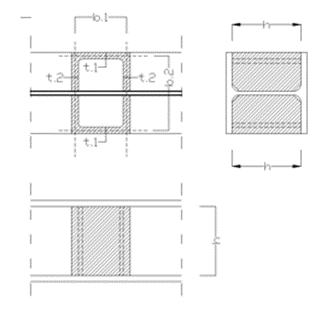
The load-bearing capacity of a thin-walled open section against lateral-torsional buckling can be increased by improving the section’s warping stiffness. This can be done by adding additional stiffeners to the section at the right locations, which will reduce the relative rotation between the flanges due to the torsional stiffness of this stiffener. In Consteel, such stiffener can be added to a Superbeam using the special Stiffener tool. Consteel will automatically create a warping support in the position of the stiffener, the stiffness of which is calculated using the formulas below. Of course, warping support can also be defined manually by specifying the correct stiffness value, calculated with the same formulas (see literature [3]).
The following types of stiffeners can be used:
- Web stiffeners
- T – stiffener
- L – stiffener
- Box stiffener
- Channel –stiffener
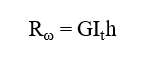
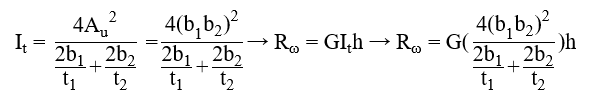
The general formula which can be used to determine the stiffness of the discrete warping restraint is the following:
where,
Rω = the stiffness of the discrete warping restraint
G = shear modulus
GIt = the Saint-Venan torsional constant
h = height of the stiffener
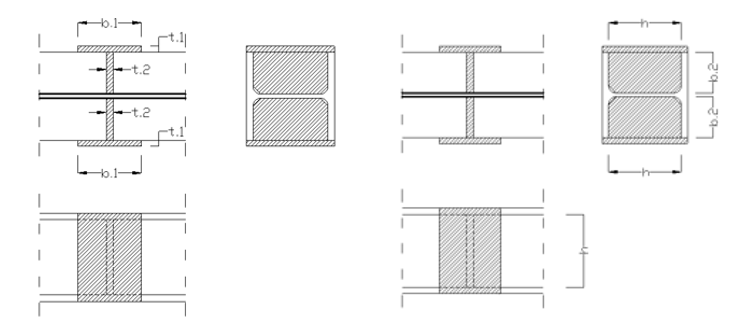
Effect of the different stiffener types
Web stiffener
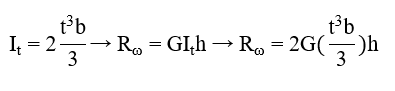
where
b = width of the web stiffener [mm]
t = thickness of the web stiffener [mm]
h = height of the web stiffener [mm]
T – stiffener
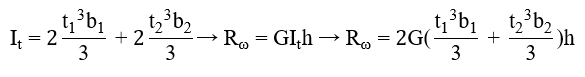
where
b1 = width of the battens [mm]
t1 = thickness of the battens [mm]
b2 = width of the web stiffener [mm]
t2 = thickness of the web stiffener [mm]
h = height of the web stiffener [mm]
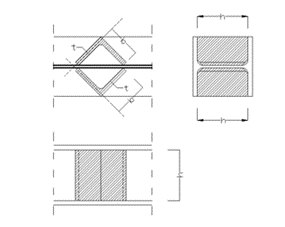
L-stiffener
where
b = width of the L-section [mm]
t = thickness of the L-section [mm]
h = height of the L-section [mm]
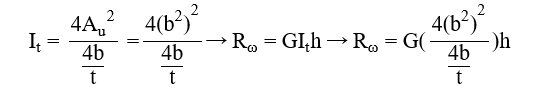
Channel stiffener
where
b1 = width of channel web [mm]
t1 = thickness of channel web [mm]
b2 = width of channel flange [mm]
t2 = thickness of channel flange [mm]
h = height of the web stiffener [mm]
Numerical example
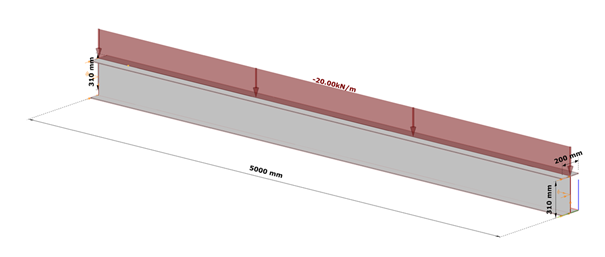
The following example will show the increase of the lateral-torsional buckling resistance of a simple supported structural beam strengthened with a box stiffeners. The effect of such additional plates can be clearly visible when shell finite elements are used.
Shell model
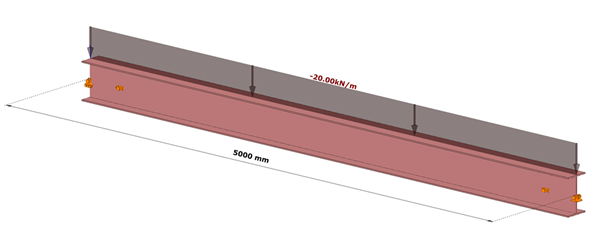
Fig. 7 shows a simple fork supported structural member with welded cross-section modeled with shell finite elements and subjected to a uniform load along the member length acting at the level of the top flange.
Table 1. and Table 2. contain the geometric parameters and material properties of the double symmetric I section. The total length of the beam member is 5000 mm, the eccentricity of the line load is 150 mm in direction z.
| Name | Dimension | Value |
|---|---|---|
| Width of the top Flange | [mm] | 200 |
| Thickness of the top Flange | [mm] | 10 |
| Web height | [mm] | 300 |
| Web thickness | [mm] | 10 |
| Width of the bottom Flange | [mm] | 200 |
| Thickness of the bottom Flange | [mm] | 10 |
Table 1: geometric parameters
| Name | Dimension | Value |
|---|---|---|
| Elastic modulus | [N/mm2] | 200 |
| Poisson ratio | [-] | 10 |
| Yield strength | [N/mm2] | 300 |
Table 2: material properties
Box stiffener
The box stiffeners are located near the supports as can be seen in Fig. 8. Table 3. contains the geometric parameters of the box stiffeners.
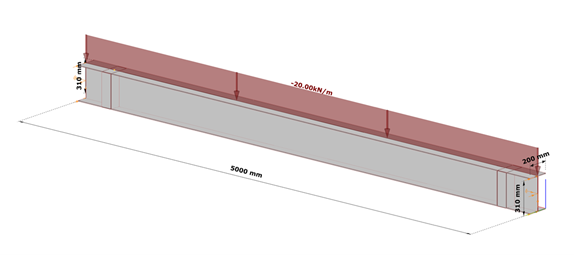
| Name | Dimension | Value |
|---|---|---|
| Width of the web stiffener | [mm] | 100 |
| Thickness of the battens | [mm] | 100 |
| Total width of the box stiffener | [mm] | 200 |
| Height of the plates | [mm] | 300 |
| Thickness of the plates | [mm] | 10 |
Table 3: geometric parameters of the box stiffeners
7DOF beam model
The same effect in a model using 7DOF beam finite elements can be obtained when discrete warping spring supports are defined at the location of the box stiffeners.
Discrete warping stiffness calculated by hand
gateThe results of analyzes of frames with a span of 12, 15 and 18 m have been presented. Their minimum mass was assumed as the optimization criterion. The finite element method was used in the calculations. The results of calculations in the form of: structure mass, bar resistance coefficient and checking the SLS condition were presented in the tables.
Click the button bellow to download and read the magazine brochure. (PL)
gateComparison of chosen methods for estimation of critical lateral torsional buckling bending moment of web-tapered I-beams. In this article, the elastic critical bending moments of the web-tapered I-beams calculated by the analytical and numerical solutions developed last years by researchers involved in the topic were compared with own calculations carried out with available common tools. The main goal was to verify the accuracy and convergence of the results provided by different modern methods and different finite bar elements 1D with 7 degrees od freedom at the node (7DOF).
Click the button bellow to download and read the full article. (PL)
gateCritical temperature calculation in Consteel
The calculation of the critical temperature is available in Consteel since the release of version 14. As an introduction of this feature, we prepared a video that gives some theoretical background on the topic, and demonstrates its usage in Consteel. It is shown how to prepare the model, how to execute the analysis and design, and how to create documentation about the critical temperature results.
Check out our user guide to learn more!
gateConsteel 14 is a powerful analysis and design software for structural engineers. Watch our video how to get started with Consteel.
Contents
- Set analysis parameters
- Perform first and second order analysis
- Perform buckling analysis
- Analysis results in graphics and in tables
- Results: deformation, internal forces, reactions
Part 2 – Imperfection factors
The Eurocode EN 1993-1-1 offers basically two methods for the buckling verification of members:
(1) based on buckling reduction factors (buckling curves) and
(2) based on equivalent geometrical imperfections.
In the first part of this article, we reviewed the utilization difference and showed the relationship between the two methods. It was concluded that the method of chapters 6.3.1 (reduction factor) and 5.3.2 (11) (buckling mode based equivalent imperfection) are consistent at the load level equal to the buckling resistance of the member, so when the member utilization is 100%. The basic result of the procedure in 5.3.2 (11) is the amplitude (largest deflection value) of the equivalent geometrical imperfection. However, the Eurocode gives another simpler alternative for the calculation of this amplitude for compressed members in section 5.3.2(3) b) in Table 5.1, where the amplitude of an initial bow is defined as a portion of the member length for each buckling curves (Fig. 1.). We use the first column (“elastic analysis”) including smaller amplitude values.
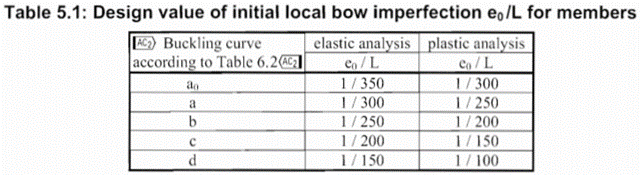
It is an obvious expectation that these two standard procedures should yield at least similar results for the same problem. However, this is by far not the case in general.
In order to show the significance of the imperfection amplitudes this part is dealing with these two calculation methods, the variation of their values and the effect on the buckling utilization.
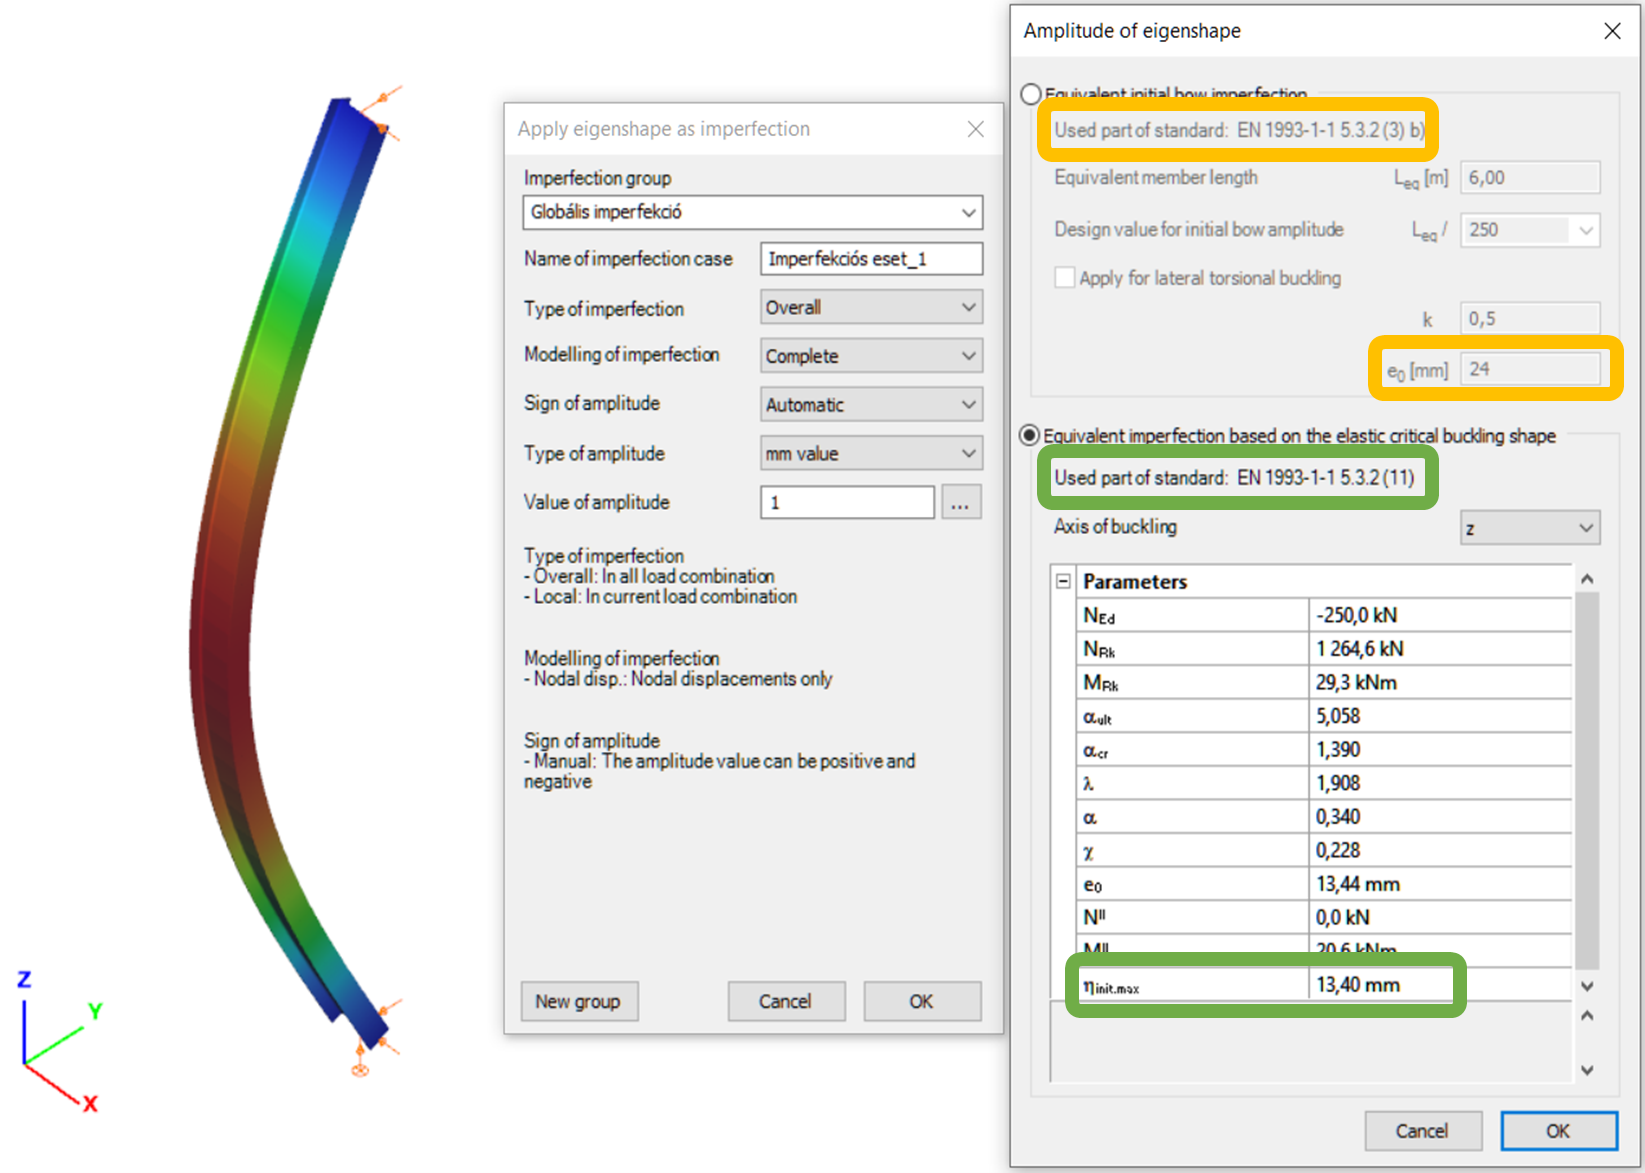
Let’s see again the simple example of Part 1: a simply supported, compressed column with a Class 2 cross-section (plastic resistance calculation allowed). The column is 6 meters high and has an IPE300 cross-section made of S235 steel. The two methods are implemented into Consteel and on Figure 2. it can be seen, that the two values for the amplitude of the geometrical imperfection is very different – e0 = 24 mm by the 5.3.2(3) b) Table 5.1 (L/250) and e0 = 13,4 mm by the 5.3.2 (11) (same as in Part 1).
This article aims to cover the theoretical background of the shear field stiffness determination methods implemented in Consteel. Modeling with the shear field stiffness based method will also be compared with shell modeling of trapezoidal deckings in Consteel.
Theoretical background
Modeling the shear stiffness of trapezoidal deckings is used to utilize their contribution to stabilizing the main structure. The possibility to consider the shear stiffness of sheetings is implemented at finite element level in Consteel and ensures easy modeling through its application onto beam elements.
Shear panel definitions
For the discussion let’s establish some basic definitions regarding shear panels.
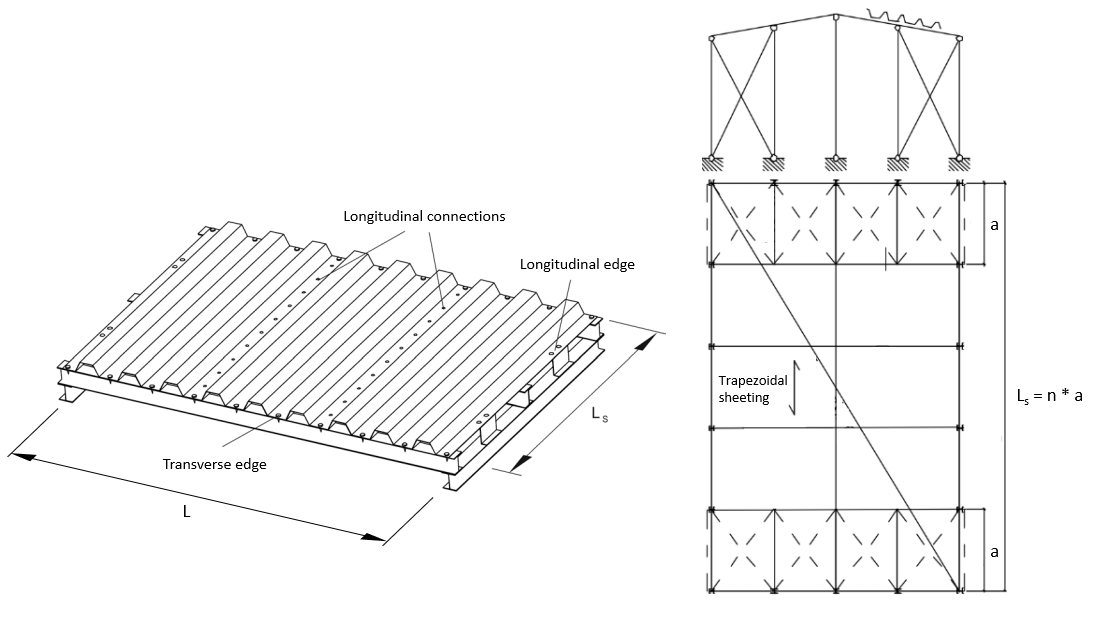
- Dimensions:
- L [m]: width of the shear field, also the span of the stabilized beam
- Ls [m]: complete length of the shear field parallel to the ribs
- a [m]: effective shear field length for only one connecting beam element
- Stiffnesses:
- Gs [kN/m]: specific shear stiffness considering a 1 m long strip of an “Ls“ long shear field
- S [kN]: shear stiffness of the complete shear field
Determaination of the shear field stiffness
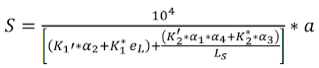
The general formula to calculate the shear stiffness in Consteel is the following:

There are 4 methods implemented in Consteel to determine the shear field stiffness:
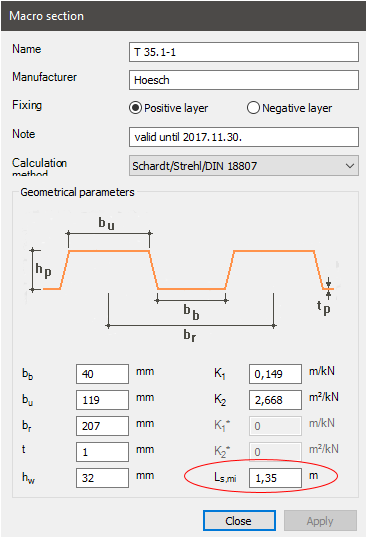
- Schardt/Strehl method: (K1, K2), DIN 18807-1:1987-06 [1]
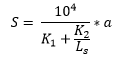
- improved Schardt/Strehl method: (K1, K2, K1*, K2* and eL)
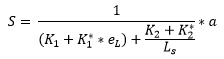
- Bryan/Davies method: (K1, K2, K1*, K2*, eL, α1, α2, α3, α4)
- Eurocode 3: (1993-1-3 10.1.1 (10)) [2]
See in more detail here: Determination of shear field stiffness and application in Consteel
The first 3 methods are based on the 1. one, the Schardt/Strehl method. These methods operate on the same principle by calculating the shear stiffness from values (K1, K2, etc.) provided by the manufacturer of the sheetings. The 2. and 3. methods are more developed versions of the 1. one, trying to more accurately calculate the shear stiffness by introducing additional parameters to account for more sources of the overall shear stiffness of the sheeting.
The 4. method that is found in Eurocode 3 can be more generally applied since that doesn’t require such product specific values.
A basic assumption in case of these methods is that the sheeting is connected at every rib to the beams that it stabilizes (purlins in most cases). An additional modifying factor in case of all these methods is if the trapezoidal sheeting is not fixed at every rib, but every second rib, then the final “S” shear stiffness should be substituted by 0,2*S.
Theoretical background of the Schardt/Strehl method
This approach is based on a model assuming a fully linear elastic behaviour of the diaphragm. The ultimate limit state is therefore defined by yielding in the corner radius at the flange-web transition. The mechanical model also assumes that the sheeting is fixed to the substructure at all 4 edges. Shear forces RQ and RL are acting on the sheeting at the individual fixed points on the lower flanges where the sheeting is screwed to the substructure. The number of waves in the sheeting is assumed to be large enough so that the individual forces acting at the transverse edges in the middle are assumed to be constant (n>10). The length “Ls” of the shear field can be arbitrary, but should be in reasonable proportion to the width “L” of the shear field (<4).
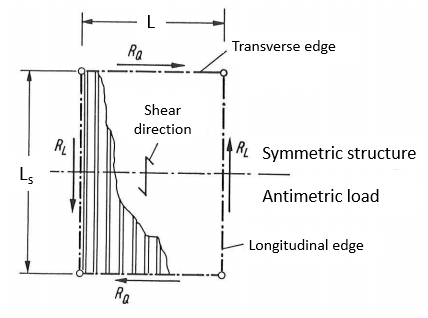
Based on these assumptions the mechanical analysis can be isolated to a half of one wave of the sheeting as shown on the left-hand side of the following figure:
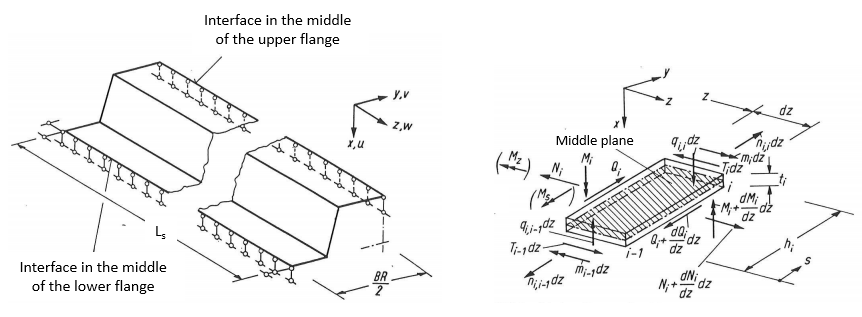
On the right-hand side the considered internal forces are shown for one slice of the sheeting.
Assumptions for the mechanical model:
- The Ms and Mz moments are neglected (shown in brackets on the right-hand side figure).
- Transverse bending moments “mi” at the level of the plate are considered. These moments have a 0 value in the center of the lower and upper flanges.
- The longitudinal stresses σz are constant over the thickness “ti” of the plates and linearly distributed over the height “hi”.
- The flexibility of connections is neglected.
The method accounts for the following effects:
- Shear deformation: corresponding value: K1 [m/kN] shows the sheetings compliance coming from shear deformation. The lower this value is, the more stiffness the sheeting has.
- Warping deformation: corresponding value: K2 [m2/kN] shows the sheetings compliance coming from warping deformation. The lower this value is, the more stiffness the sheeting has.
Component considering shear deformation
The value K1 can be calculated from the following formula based on the properties of the trapezoidal sheeting:
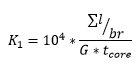
where
- ∑l [mm]: Summed up length of all the plates within one full wave
- br [mm]: length of one complete wave
- G [N/mm2]: shear modulus
- tcore [mm]: structural thickness. (generally: tcore = tnominal – 0,04 mm)
The formula of the K1 value is similar to how it should be calculated in case of a planar plate, but its thickness corrected with the ∑l/br ratio, or in other words the ratio of the complete length of the plates to the length of one wave. The K1 shear deformation compliance value is directly proportional to the ∑l/br ratio, therefore if a certain trapezoidal sheetings height is increased with everything else left the same, the corresponding K1 value would increase, and the stiffness coming from shear deformation would decrease. On the other hand the K1 value is inversely proportional to “G” shear modulus and “tcore“ structural thickness, so if either of these values would increase, K1 would decrease, and the stiffness coming from shear deformation would increase.
Component considering warping deformation
The K2 parameter further softens the structure taking into account the warping deformations. The detailed calculation of the K2 parameter will not be shown here due to its extensiveness and complexity. The details of this calculation can be found in the literature [5]. The calculation is based on the “Folded Plate” theory [8]. To obtain the K2 parameter the warping displacements and warping coordinates have to be calculated for the sheeting. The following figure shows an example for the normalized warping displacements and deformed shapes for k=1 and k=2:
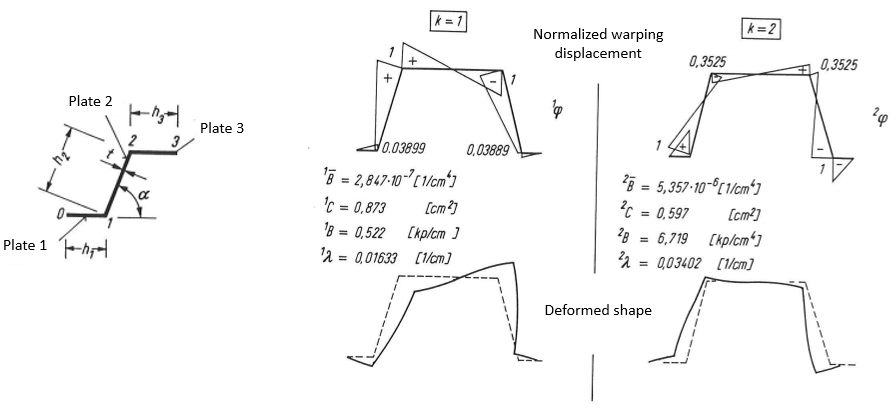
k=1 and k=2 are connected to individual solutions for the differential equation system describing the mechanical behavior based on the “Folded Plate” theory.
Calculating shear stiffness
The behavior of the two components in the formula of the shear stiffness is different. The part that considers the shear deformation only depends on the effective width “a”, but independent from the total length of the shear field “Ls”. On the other hand the part that considers the warping deformation is also dependent on the total length of the shear field “Ls”. The K2 parameter in the denominator is divided by Ls, which means that the longer the total shear field is, the larger the specific shear stiffness is going to get because of the contribution of the warping deformations.
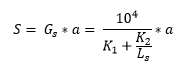
Also if the total length of the shear field “Ls“ would get really low, then K2/Ls would approach infinity, which means that the stiffness approaches zero. For this reason a minimal length for sheetings “Ls,min” is also provided by the manufacturers, which gives the specific shear stiffness “Gs” a minimum value.
Comparison against shell models
The effect of the shear stiffness of a trapezoidal sheeting can be modeled in multiple ways. In Consteel additionally to built-in shear field field object applicable on beam elements, the sheeting can be modeled directly with shell elements. This latter approach is more complicated and time consuming to set up, but should provide similar results. Such a comparison was prepared in Consteel.
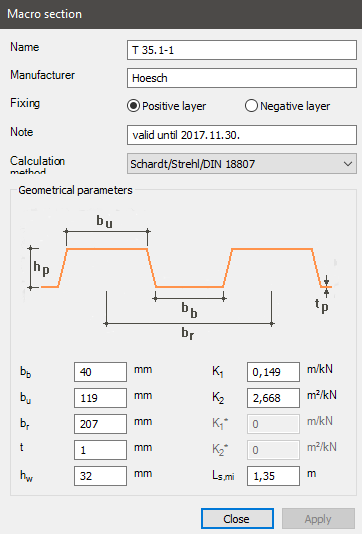
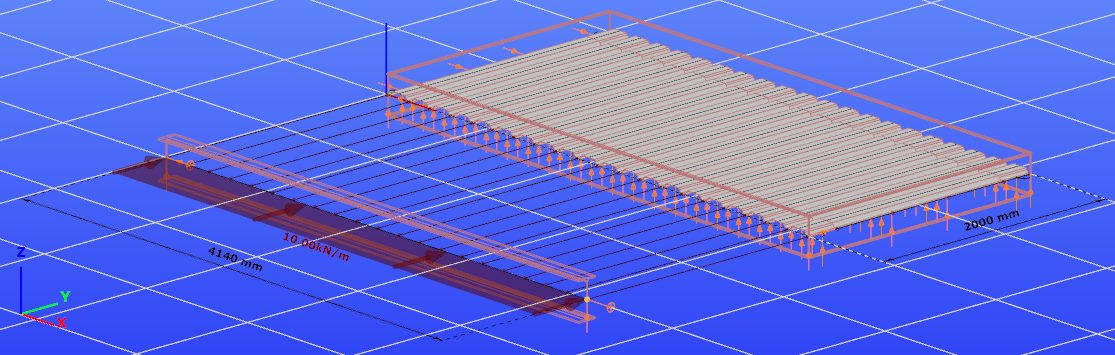
Examined structure
Stabilized beam: IPE300 S235
Span: L = 4140 mm
Type of trapezoidal sheeting: Hoesch T 35.1
- Examined thicknesses: 0,75 mm; 1 mm; 1,25 mm
- Examined sheeting lengths: 2 m, 3 m
Horizontal line load: qy = 10 kN/m
The load and the trapezoidal sheeting are both acting on the centerline of the stabilized beam.
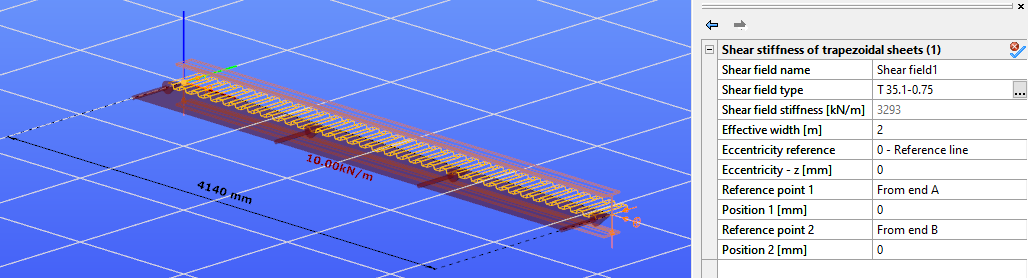
Consteel shear field model
In this modeling version the stabilizing effect of the trapezoidal sheeting is modeled by the shear field object implemented into Consteel.
Example figure: Ls = 2 m, a = 2 m, Gs = 3293 kN/m, S = 6586 kN
Consteel shell model
In this modeling version, the trapezoidal sheeting is modeled by shell elements. The thicknesses of the shell elements are equal to the structural thickness tcore. The model of the trapezoidal sheeting is included in a frame made from beam elements. The sheeting is connected to the frame by link elements at the lower flanges where the sheeting is screwed to the substructure. The frame is included in the model in order to connect the shell elements to the main beam. The beams of the frame have a cross-section that has relatively insignificant weaker axis inertia compared to the shear stiffness of the sheeting. The shell elements are connected through the frame to the main beam by link elements that only transfer force in their axial direction.
Example figure: Ls = 2 m, a = 2 m
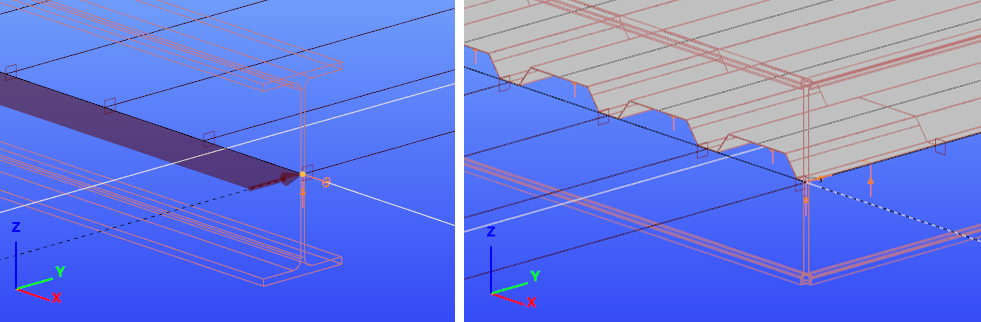
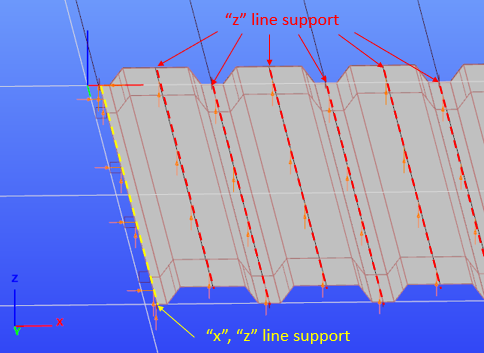
The shell elements are also supported in the vertical direction along the middle lines of its top and bottom flanges in order to eliminate the bending deformation resulting from the eccentric compression load on the sheeting, since the shear field model also does not take this effect into account. The edges on both sides of the sheeting are supported against “x” and “z” directional displacements in order to account for the sheeting being fixed to the substructure at all 4 of its edges. The line supports on the plate elements are shown on the following picture viewing the structure from below.
Horizontal displacement examination
gateModeling of tapered elements
Stability calculation of tapered members is always a difficult problem despite its popularity in steel hall construction.
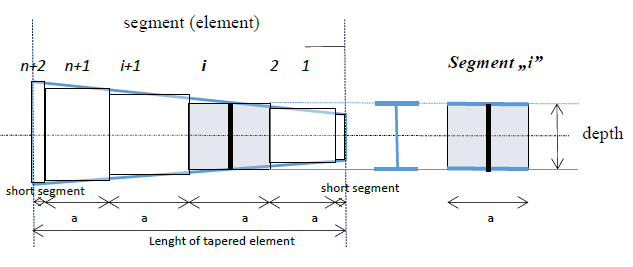
Generally in analysis software for the stability analysis a segmented but uniform beam element method is used where a member with I or H cross section and with variable web depth is divided into n segments and the depth of each segment is taken equal to the real depth measured at the middle of the segment. The lengths of the segments were taken equal, except at both ends where additional shorter segments are added in order the better approximate the real depth of the elements to be modeled. Such model captures correctly the in-plane displacements, but cannot consider accurately the additional torsion coming from the axial stresses due to warping in the flanges which are not parallel with the reference line in case of tapered elements.
This simplification may cause incorrect results in calculating buckling modes involving torsional displacements like flexural-torsional buckling of columns or lateral-torsional buckling of beams especially in cases where the beam flanges have longer unbraced lengths.
Consteel analysis model for tapered members
In order to improve the accuracy of the stability analysis of structural models including tapered members Consteel uses a special tapered beam finite element. A basics of this unique finite element have already been published by other researchers however up to now Consteel is the only commercial software which has implemented this finite element for the buckling analysis.
The mentioned problems arising from the non-parallel flanges can be fixed by considering appropriate additional terms in the element stiffness matrix. The final stiffness matrix can be written as a sum of original stiffness matrix and the additional terms:
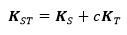
Where KS is for the original stiffness matrix with uniform cross section and KT contains the additional terms valid for doublesymmetric and monosymmetric I and H cross sections.
The additional terms in KT use the following special cross section parameters:
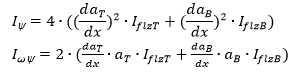
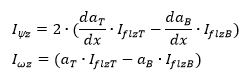
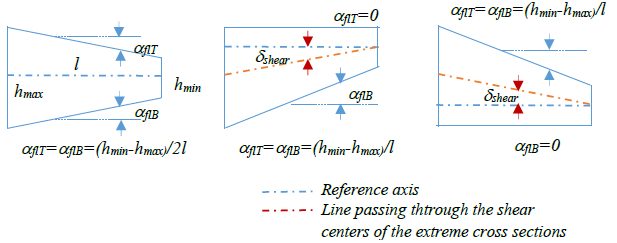
Where IflzT and IflzB are the intertias of the flange related to z axis (parallel to the web), for upper (T) and bottom (B) flanges, respectively, aT and aB is the distance between the centerline of upper and lower flange and the line parallel with the reference axis of the element and passing through the shear center of the middle cross section, as seen on the picture below in case of double symmetric I and H cross section.
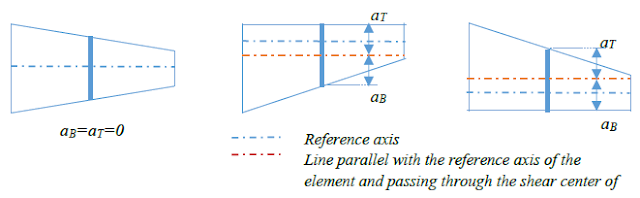
Additionally daT/dx and daB/dx means the angle between the upper and lower flanges and the line parallel with the reference line of the element and passing through the shear center of the middle cross section, respectively. As an approximation these can be expressed as:

where aflT and aflB are the angles between the flanges and the element reference line, ẟshear is the angle between the lines passing through the centers of gravity and shear centers of the extreme cross sections of the elements.
Comparison of results
This part shows some validation examples for the accuracy of the implemented new finite element compared to published numerical results and analysis by shell elements. The examples show the very high accuracy of this element even in the most challenging buckling cases where the segmented uniform beam element method yields some extent of inaccuracy.
gate