- Contents
Pressure-based validation on simple blocks
In this article, we will explore pressure-based validation techniques applied to a simple block model within the context of wind simulation for structural engineering. Building upon our previous discussions on data processing and velocity-based validation, we aim to provide a comprehensive understanding of how pressure data can be utilized to ensure accurate and reliable wind surface loads from simulation results.
Pressure-based validation is a critical aspect of wind simulation, as it directly relates to the forces exerted on structures. During previous velocity-based validations [1] comparing the results (the average directional deviances of the velocity vector as a percentage) against established benchmarks showed that k-ε turbulence model produced the best results. Using the same simulations results the pressure-side comparison is presented below.
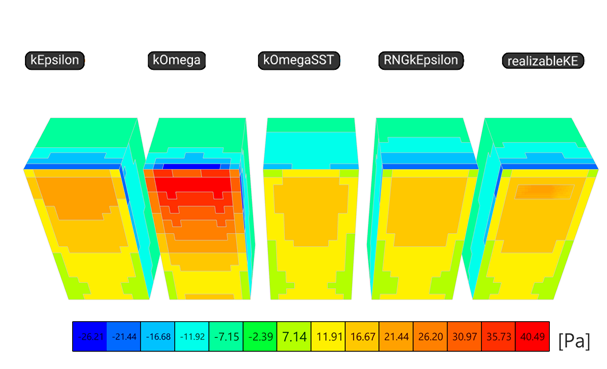
First, there is a significant difference between the simulation runtime and the iteration number, which was set to a maximum of 1000 iterations. The table below shows that the k-ε is the quickest, while k-ω SST and RNGk has not actually reached convergence. However, when comparing the global reactions calculated according to the pressure results the results are relatively close, more for the suctions on the top (Rz) and on the side walls (Ry), but less for the Rx (resulted by the pressure on the windward and the suction on the leeward walls), especially for k-ω.
Note: the Ry+ is only the resultant for one side wall of the cuboid, because the other side eliminates it, resulting a global reaction of Ry = 0 kN
| Load size [m] | 4 | ||||
| Turbulence Model | k-ε | k-ω | k-ω SST | RNGk | realizable k-ε |
| Runtime [s] | 135.295 | 392.686 | 707.589 | 663.564 | 440.801 |
| Iteration [-] | 197 | 413 | 1000 | 1000 | 342 |
| Rx [kN] | 195.63 | 315.59 | 179.88 | 176.23 | 180.22 |
| Ry+ [kN] | 94.54 | 97.75 | 92.98 | 96.95 | 95.73 |
| Rz [kN] | 53.47 | 50.02 | 52.74 | 58.64 | 54.33 |
| ADD [%] | 5.86 | 5.83 | 9.45 | 6.58 | 6.03 |
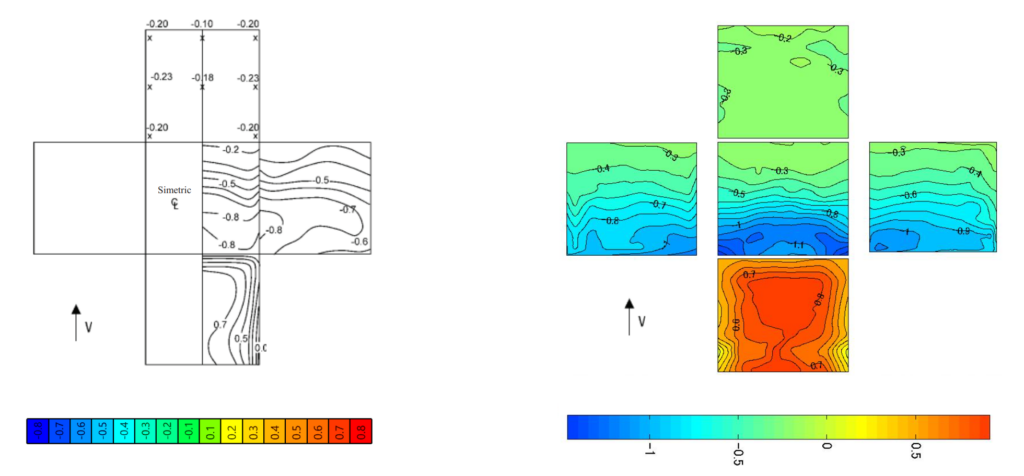
To conclude regarding the suitable turbulence models and to carry out relevant pressure-based validations it is preferable to use wind tunnel results adressing this topic directly. One of the earliest results [2] in this field by Baines, which forms the basis for the standards used today and a relatively new, thorough examination [3] by the Tokyo Polytechnic University is used as a starting point.
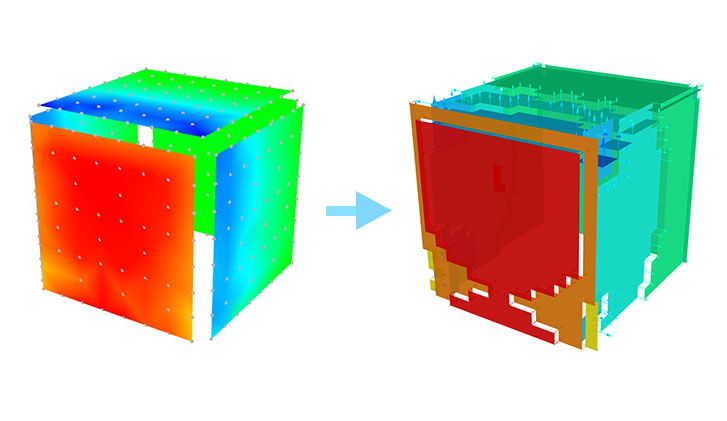
To process these results special tools were developed. The results by Baines in lack of any database was reproduced using the contour lines from the original image, while for the TPU experiment mean result values from actual measurement point results were processed in Grasshopper's parametric environment.
Note: the color gradient for the result represenation is not harmonized according to the pressure coefficient results.
The mesh resulted by the points from the TPU results indicates an average edge length to start performing simulations. For this cuboid of 16 m x 16 m x 16 m, the ‘mesh size on the structure’ , or in other word the face edge length is 2.28 m, resulting a unified mesh suitable for post-process. For the refinement of the calculation domain a ‘mesh refinement factor’ of r = 2 was selected to reach an inlet face size below the reference height of 16 m (2.28 x 2r = 9.12 < 16). Regarding the wind profile, based on the TPU experiment, according to the Eurocode [4] a category III terrain was selected which is similar in turbulence intensity (Iv(zref) = 0.25). For the basic wind velocity, vb = 28.3 m/s was taken to produce a peak velocity pressure, qp(zref) = 1 kN/m2 for easier conversion between pressure coefficients (cpe) and surface wind loads (we).
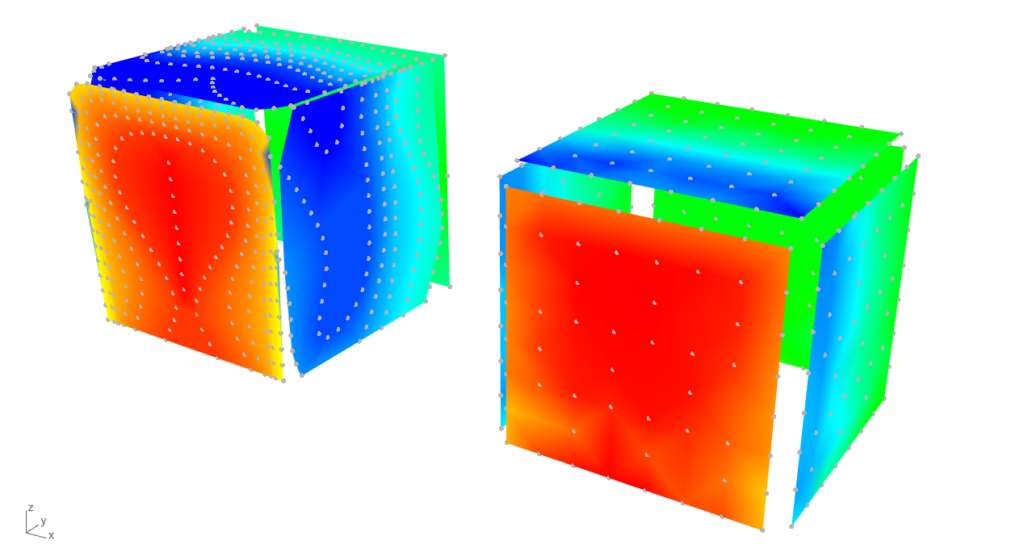
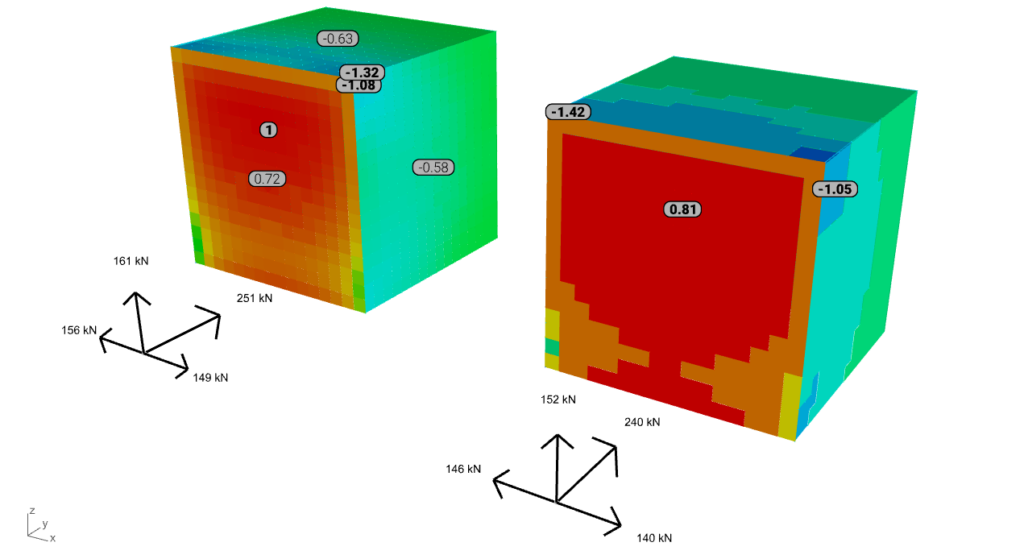
Note: the color gradient for the result represenation of all six cases below is harmonized according to the surface load results. The values with bold are the peak (min or max) values for the windward, top, and side surface, while the narrow font represents the mean value. The axis system in front is representing the resultants of the surface loads.
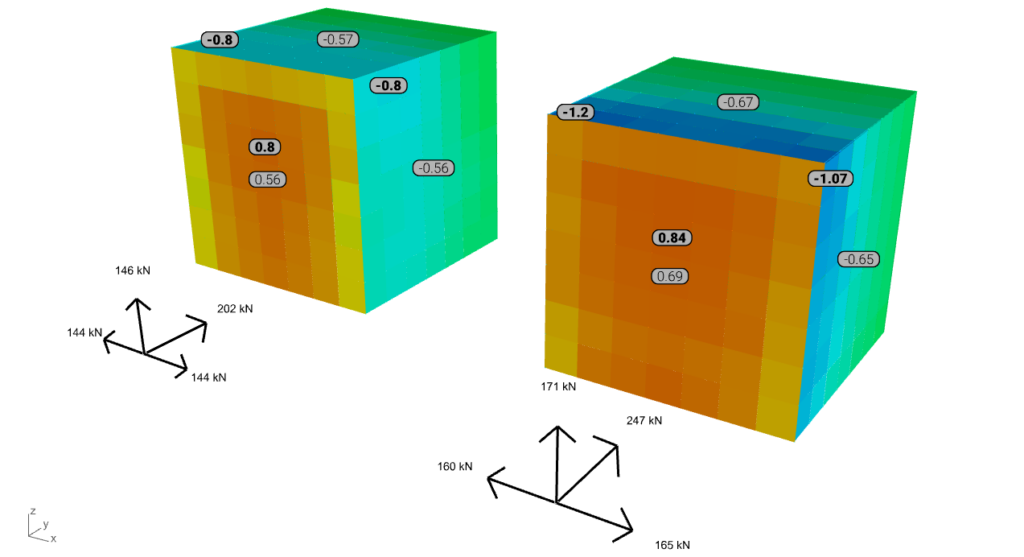
Upon projecting the experimental data onto the post-process mesh based on mesh vertex proximity, it was observed that the results from Baines are generally lower. This discrepancy is likely due to reduced accuracy at the edges and, more notably, at the corners. However, on the windward side, the maximum pressure coefficient is approximately 0.8, while the suction values also align with typical Eurocode values.
When examining global reactions or resultants, the simulation outcomes tend to align with the TPU results, especially on the windward side. Conversely, for the suctioned surfaces, such as the side walls and top, the simulation results are generally lower on average.
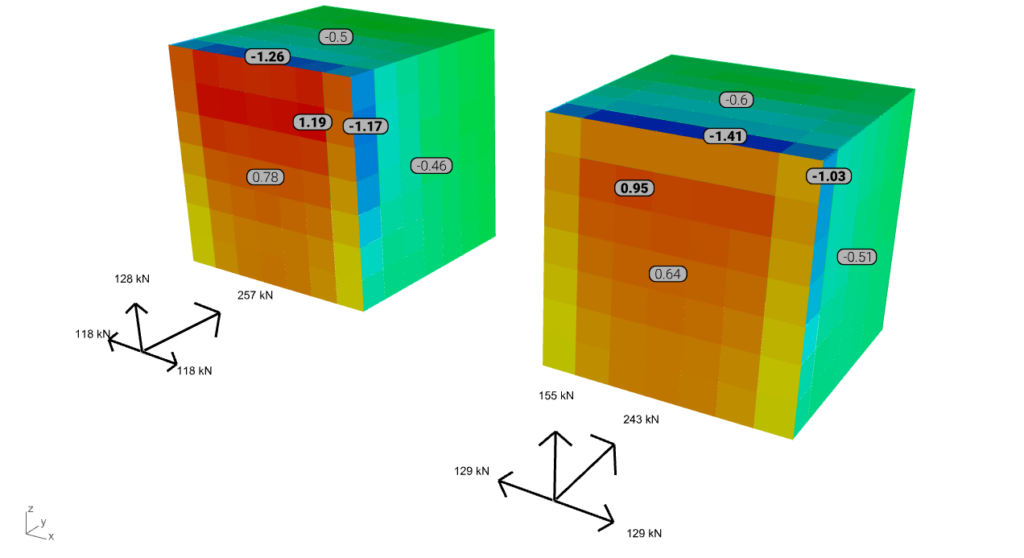
From the perspective of this pressure-based validation k-ω SST demonstrates improved accuracy, particularly when the ‘mesh size on the structure’ is refined to 1 meter. This refinement enhances the correlation of results, including on the suction sides. However, the model's robustness can be questionable, leading to increased computational time for convergence.
For structural engineering purposes the zoning of these loads can actually offer efficiently usable loads during structural analysis, comparable with standards. From this scenario two advantages of simulated loads can already be observed:
- For the windward side loads with similar distribution to the wind tunnel experiment can be produced, leading to reduced loads instead of one uniformly distributed surface load (D zone of Eurocode)
- For the side walls the decrease of the loads along the height can also be produced with simulation, leading to reduced load areas for A zones of Eurocode
While obtaining wind tunnel experiment data for thorough, double-checked validation can be challenging due to limited background information, our current validations already highlight that mesh density and the appropriate selection of turbulence models are pivotal factors significantly affecting pressure distribution. Striking an optimal balance between accuracy and computational efficiency remains the challenge of the beta testing period. Consequently, in forthcoming articles, we plan to broaden our validations to encompass larger-scale models with typical geometries. This expansion aims to facilitate meaningful comparisons with established standards and to provide comprehensive guidelines for efficient wind load generation post-processed from simulation results.
References:
[1] Dataprocessing and velocity-based validation on a simple block - https://consteelsoftware.com/ro/knowledgebase/dataprocessing-and-velocity-based-validation-on-a-simple-block/
[2] Baines, W. D., 1963. Effects of velocity distributions on wind loads and flow patterns on buildings, Proceedings, International Conference on Wind Effects on Buildings and Structures, Teddington, U.K., 26–28 June, 198–225
[3] Aerodynamic database for low-rise buildings - https://wind.arch.t-kougei.ac.jp/system/eng/contents/code/tpu
[4] EN 1991-1-4: Eurocode 1: Actions on structures - Part 1-4: General actions - Wind actions
The author
 Ádám Kis
As a Structural Engineer he was obsessed with parametric design methods. He is convinced that it can be efficient for any design task. This is how he came to the dark side and works as a developer on Pangolin. As a PhD student, he researches the implementation of simulation methods in Consteel.