Assessing the condition of existing steel structures built decades ago is a recurring task in design practice, particularly when the original design documentation is incomplete or the structure’s condition has changed over time. One such assessment involved the structural verification of several high-voltage transmission line support types using Consteel. The original design documentation of the supports presented here dates back to around 1968, while the assessment itself was carried out in accordance with currently applicable standards.
The two support types presented gave different results: the PIC 400 passed all checks, while the PAS 400101 required strengthening – this latter case is presented in detail below.
STANDARDS AND METHODOLOGY
The structural verification was performed on a spatial (3D) finite element model, with loads determined based on the actual spans, in accordance with SR EN 50341-1:2013 [1] and SR EN 50341-2-24:2019 [2], the standards governing overhead lines exceeding AC 1 kV. The reliability level applicable to the supports is Level 1 (50-year return period), with a partial safety factor for the maximum wind load of γW = 1.0.
The assessment covered the following load combinations as specified by the relevant standard: N1, N2a, N2b, N3, N4a, N4b, as well as the security load cases A1 and A2. The most critical combinations are generally the combined action of wind and ice loads perpendicular to the conductor (N2a, N2b), and the simultaneous action of nominal wind and extreme icing under conductor breakage (A1), particularly for suspension and tension supports located at angle points. Every support examined was checked for both strength and global stability, using the governing combinations for the given support type. Utilization ratios were determined in accordance with the standard, with stability checks carried out using the General Method [3], which automatically evaluates the structure’s resistance to loss of stability without requiring manual input of buckling lengths – a significant simplification compared to traditional analytical methods. (For a simple example illustrating the difference between the two methods, see this link.)
INCORPORATING THE ACTUAL GEOMETRY INTO THE MODEL
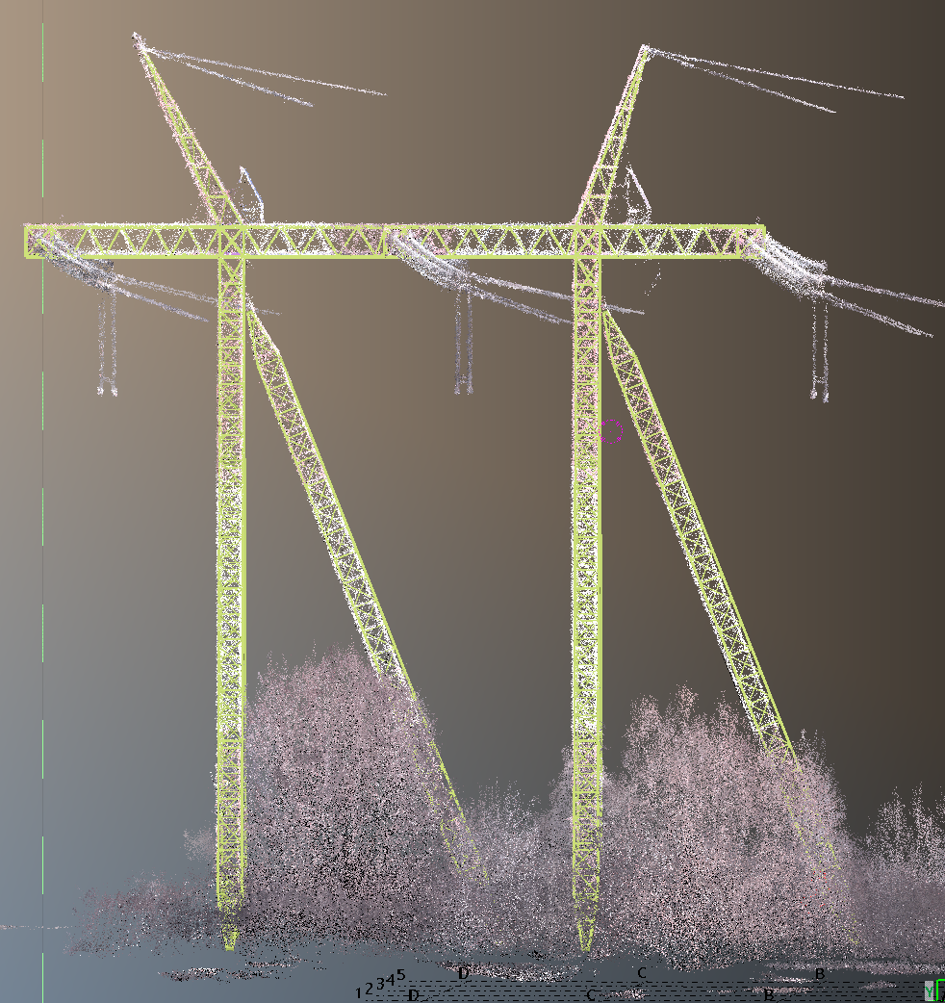
A key element of the assessment is that the calculation was based not on the geometry of the original design documentation, but on the structure’s actual, present-day condition. The field survey was carried out using laser scanning technology, enabling point-cloud-based analysis; from this, the support types were identified (distances between legs and conductors, dimensions of the main structural members). Building the calculation model in Consteel is quick and straightforward, and if the structure has also been modeled in Tekla, the model can be easily transferred into Consteel, avoiding the need to build the geometry twice.
Determining the vertical deviation (tilt) of the structural members was carried out as a separate step: the calculation model and the point cloud were compared in Tekla Structures, and the resulting deviations were incorporated into the final Consteel model as global imperfections. Since the standard does not specify deflection or tilt limits, the verticality of each support was assessed individually, using the same General Method that automatically evaluates loss of stability without requiring input of buckling lengths.
The survey also included verification of the wall thickness of the structural members: although the corrosion protection coating showed significant degradation, no actual reduction in cross-section was detected.
EXAMINED TOWER TYPES
Based on the visual survey, three of the most common tower types with the largest spans/loads were selected for detailed assessment. Two of them are presented below; a third type, designated SAC 400107, was also verified, but its results are not detailed within the scope of this article.
The PAS 400101 tower – requiring strengthening
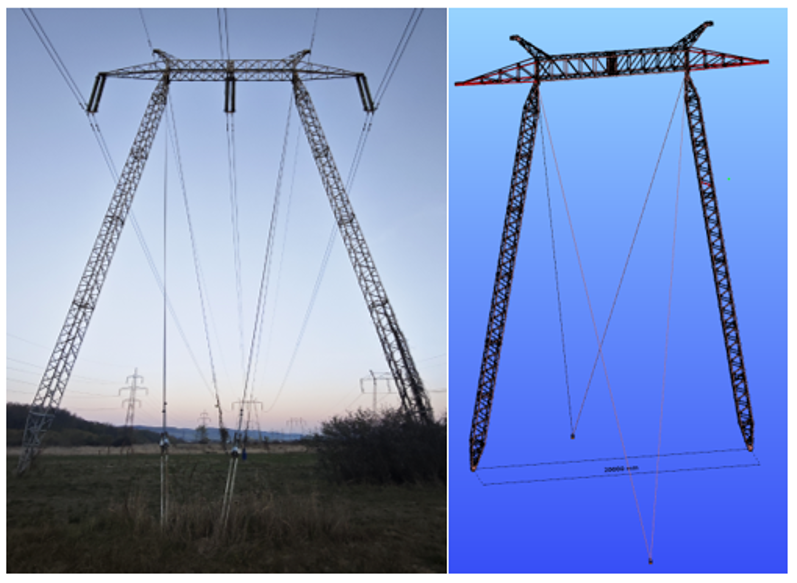
The PAS 400101 is one of the most common suspension tower types in the network; its main load-bearing frame consists of L70×7 leg members and the transverse bracing elements. The conductors are attached to the cross arm, at the insulator connection points, this zone was therefore given particular attention during the assessment.
Load combinations and evaluation
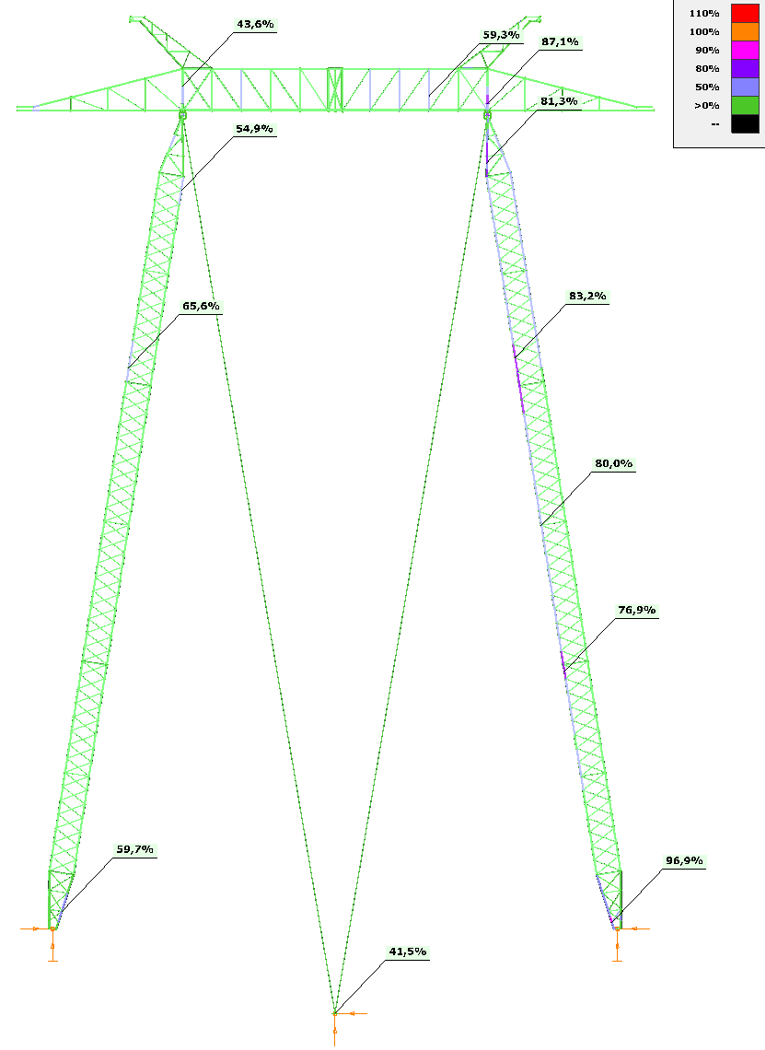
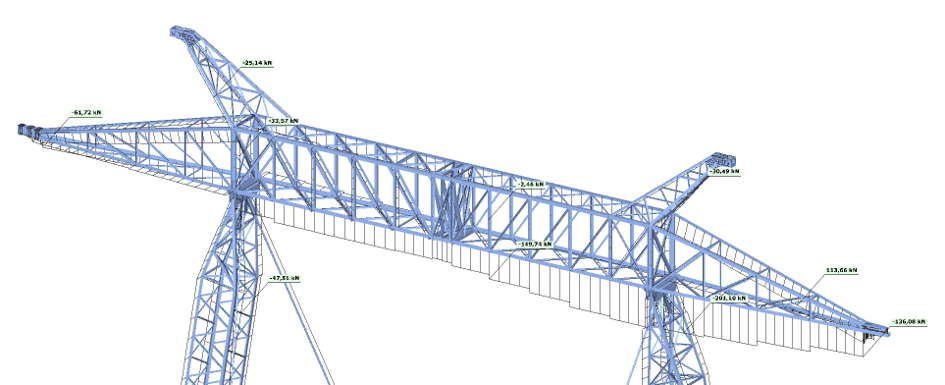
Under the N1 load combination, all structural members remained within the permissible limit, with the highest utilization (96.9%) occurring at the main legs. Under the N2a combination, a utilization of 108.8% was already obtained at the upper part of the cross arm, at the insulator connection point, while the main structural members remained below 80%, so the cross arm required local strengthening.
The most critical condition was represented by the A1 combination (conductor breakage): breakage of the upper right-hand conductor was modeled, and the highest utilization reached 168.4%, at the lower foot of the cross arm. The overload at this point resulted from the section being subjected to a force perpendicular to its principal axis of inertia, which led to loss of stability. This was not the only point exceeding 100%: values above 100% were also obtained at five further points within the cross arm zone, indicating that the problem does not stem from a single local weakness, but from an inadequate member layout of the cross arm as a whole. Meanwhile, the main legs operated with a utilization below 60% throughout.
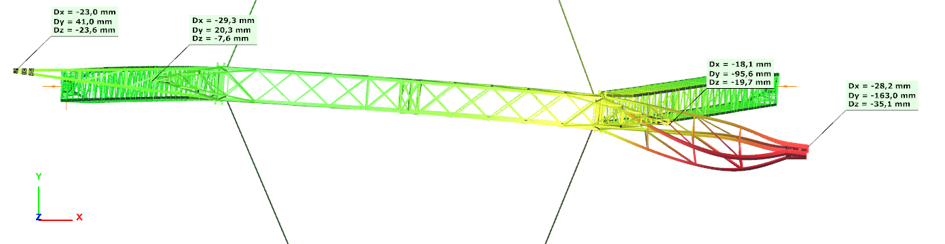
VERTICALITY CHECK
Comparison of the point cloud with the ideal geometry showed a horizontal deviation of about 50 mm, which was incorporated into the model as an imperfection; upon re-analysis, the highest utilization reached 96.9%, confirming that the structure met the stability requirements.
STRENGTHENING PROPOSAL
Due to the trapezoidal shape of the cross arm end, the originally tension-compression member system behaved instead as a bent frame acting like a Vierendeel girder, the absence of diagonal members caused significant bending moments that the existing sections could not resist. The proposed solution consists of three elements: diagonal members (L50×4) in the plane of the cross arm and at the lower foot, restoring truss-like (axial) behavior; stiffening plates (10 mm, S235 JR) to optimize load distribution and prevent local buckling; and high-strength bolted connections that preserve the original pinned joint behavior. This ensures the load-bearing capacity of the cross arm zone and eliminates the identified overloads.
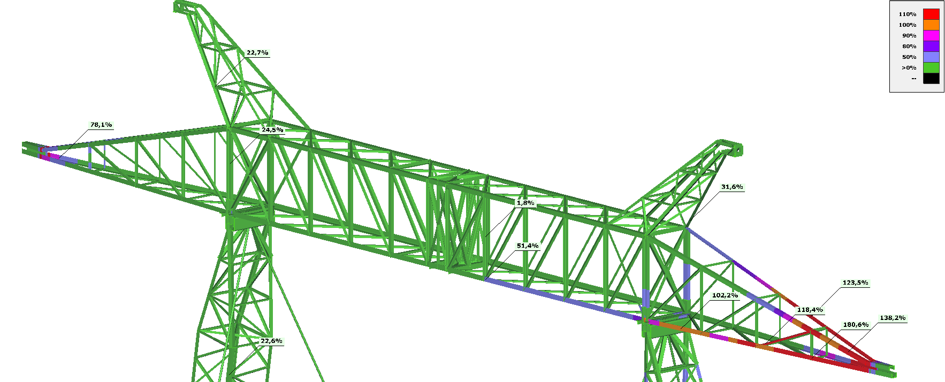
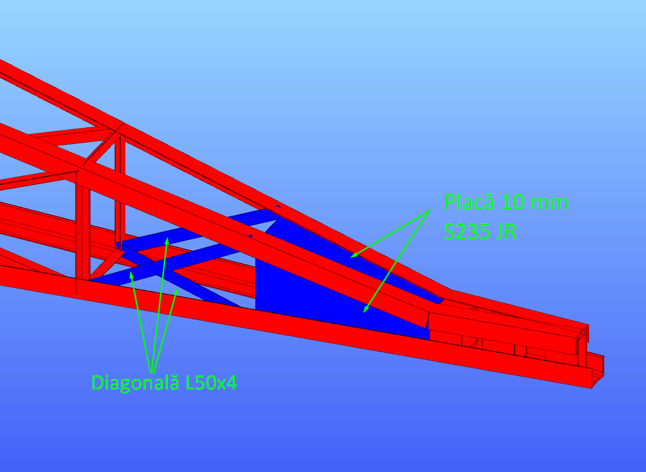
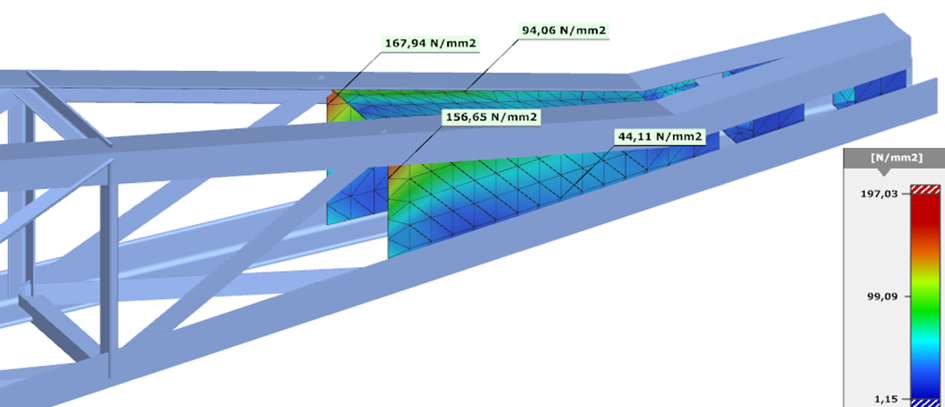
This solution ensures adequate load-bearing capacity of the cross arm zone and eliminates the identified overloads.
The structurally safe PIC 400 tower
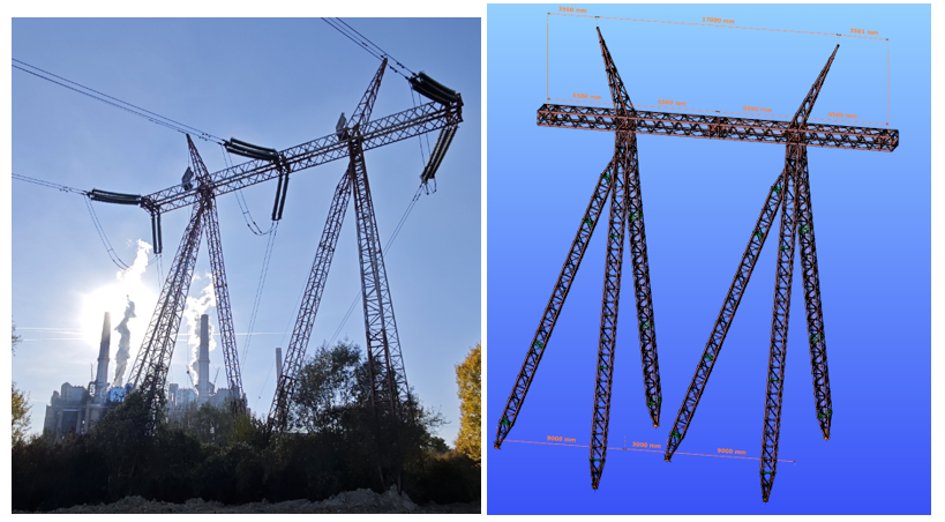
The structural configuration of the PIC 400, through its main legs and diagonal bracing, provides increased stiffness for both transverse and longitudinal loads. Under the N2a combination, the highest utilization was 91.7%, near the tower tip; under the A1 combination (conductor breakage), it was 85.2% at the lower foot of the transverse member. Comparison of the point cloud with the ideal geometry showed a horizontal deviation of about 140 mm at the tower tip; once this was incorporated into the model as an imperfection, utilization in the affected zone rose slightly, to 80.5–82.5%. The magnitude of the deformation is significant, but based on the stability assessment the structure can be operated safely, and the deviation does not result in a critical condition.
SUMMARY
This assessment clearly demonstrates how an existing steel structure, designed decades earlier, can be verified against current standard requirements, taking into account its actual geometric condition as surveyed by laser scanning. The PIC 400 passed all examined load combinations; for the PAS 400101, however, a clearly identifiable structural issue, inadequate member layout of the cross arm zone, was uncovered, for which a targeted strengthening proposal was also developed.
REFERENCES
[1] SR EN 50341-1:2013 – Overhead electrical lines exceeding AC 1 kV – Part 1: General requirements – Common specifications
[2] SR EN 50341-2-24:2019 – Overhead electrical lines exceeding AC 1 kV – Part 2-24: National Normative Aspects (NNA) for Romania
[3] EN 1993-1-1:2006 – Eurocode 3: Design of steel structures – Part 1-1: General rules and rules for buildings 6.3.4
This time, we will take a look at the pioneering technologies used and developed by one of our customers, as well as the implementation in Consteel software for the structural design process, which has allowed them to evaluate and design to the significant loads that a solar panel support structure can be subjected to. The benefits of using Consteel in terms of workflow and productivity will also be demonstrated.
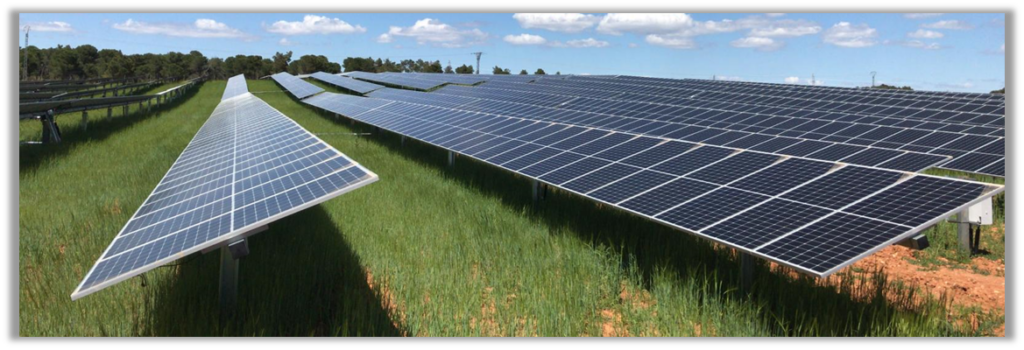
Array Technologies (STI Norland) is a company founded in Spain dedicated to the construction and implementation of photovoltaic utilization projects, including both tracking systems and fixed systems. In 2002, it built the world’s first solar tracking plant in Navarra.
PROJECT DESCRIPTION
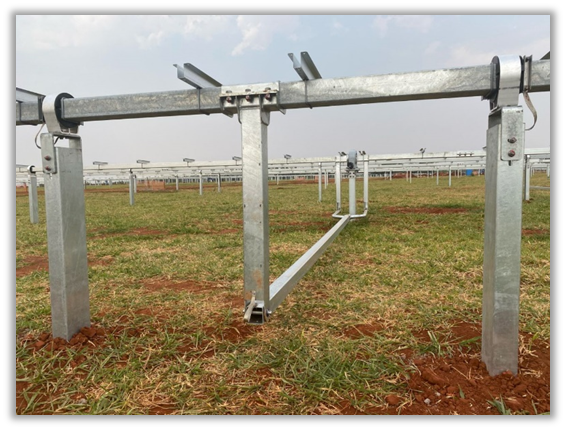
Located in Alfajarín, in the province of Zaragoza, the project involves the construction of a field of horizontal-axis photovoltaic solar trackers. It consists of two torsion beams that support the modules. This beam allows rotation through a transverse mechanism that moves the modules in an east-west direction, following the sun’s trajectory.
The oscillatory movement of the solar modules is calculated using an astronomical calculation algorithm, which also takes into account potential shading between adjacent rows of modules, thus avoiding it and increasing energy production by up to 5%.
The project is situated at an altitude of about 380 meters and consists of 29 photovoltaic modules per row. Each module weighs 32.3 kg, so each line must support a total of nearly 950 kg, distributed along it. This weight only accounts for the equipment load, not considering the significant wind pressures generated over a surface area of approximately 2.5 m² per photovoltaic module, which can amount to a little over 74 m² of surface area of photovoltaic panels per row.
CONSIDERATIONS
The analysis was primarily focused on the effect of wind loads due to their significance compared to other loads. Initially, since the structure is relatively light, it is not susceptible to the inertial effects caused by earthquakes. Snow loads were not analyzed because the tracker is designed to operate with a stable snow layer of approximately 10 cm thickness. Additionally, the oscillatory movement prevents the accumulation of a thicker snow layer. The tracker also has a snow sensor that constantly measures the snow thickness; when it reaches 8 cm, the tracker moves into a snow safety position, angling itself at 45 degrees to help shed the accumulated snow.
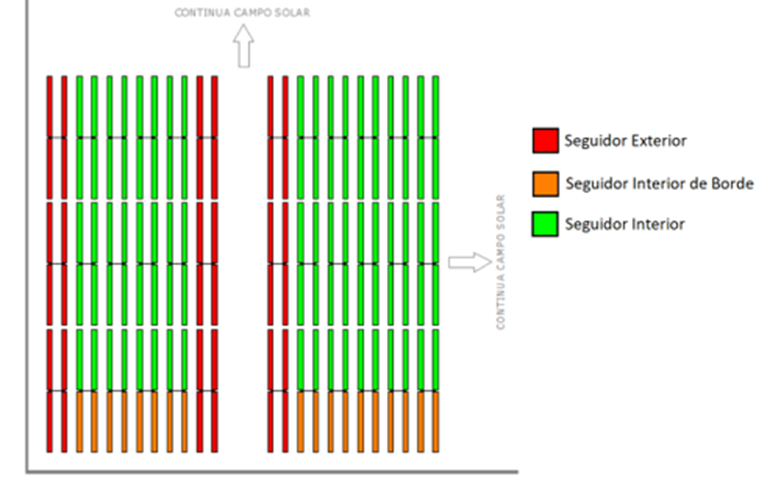
Since the constructed project consists of photovoltaic trackers, different positions of the trackers throughout the day must be considered. Additionally, different rows of modules will be affected depending on their arrangement in the plant.
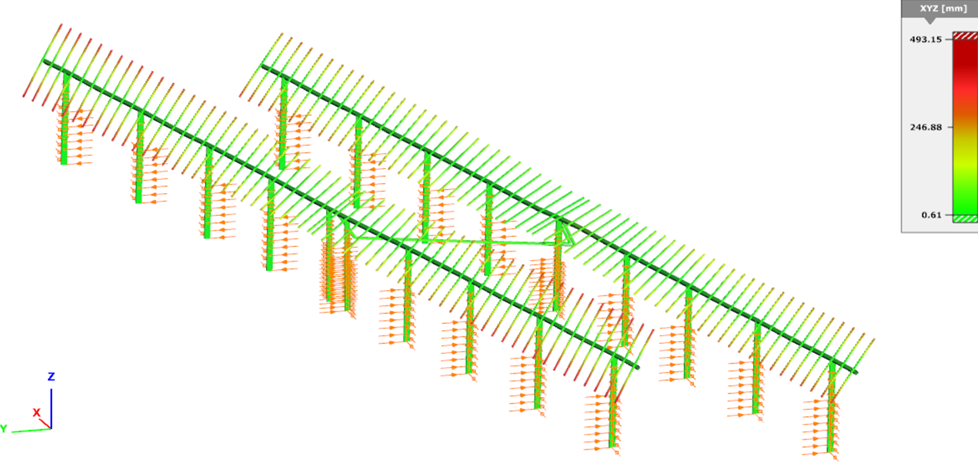
As presented, three groups of trackers can be identified based on their level of wind exposure: internal trackers (Seguidor Interior), which will have a lower degree of exposure; trackers on the interior but at the edge (Seguidor Interior de Borde), which will have an intermediate degree of exposure; and external trackers (Seguidor Exterior), which have a higher degree of exposure.
Finally, by considering the permutations between the different types of trackers, their positions throughout the day, and the wind direction, we have the following possible cases to evaluate.
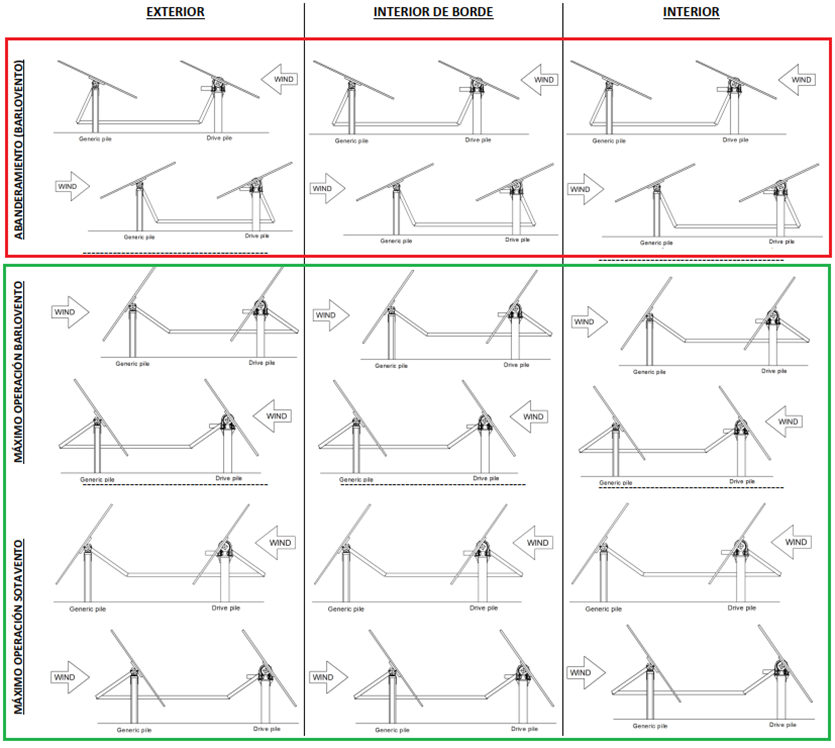
The case when the wind is from “behind” is not considered because the tracker is equipped with an anemometer. When wind speeds exceed 60 km/h, which is the design speed, the tracker enters in a position to face the wind. In this position, the structure experiences significantly less stress, whereas “behind” wind at these speeds can lead to various types of aerodynamic instabilities, which would compromise the integrity of the modules.
Given the sensitivity of the possible results, the cases can be reduced to only those highlighted in red, which represent the frontwise wind scenarios. Ultimately, the design is governed by the most exposed trackers, so the design case would be the frontwise wind, specifically for the external trackers.
MODELING IN CONSTEEL
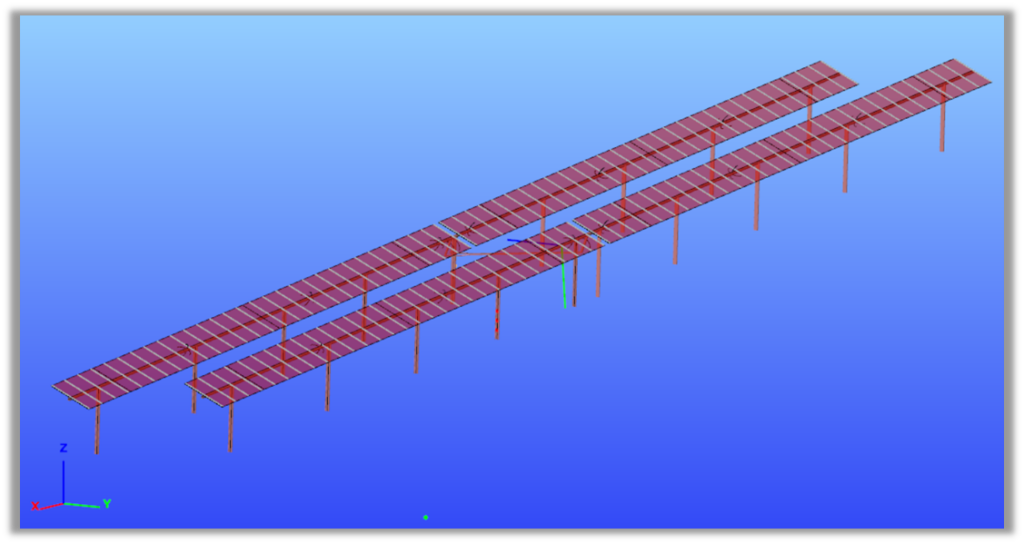
At Array Technologies (STI Norland), there are technical sheets containing all the specific dimensions of these structures. Using Descript, the internal scriping language of Consteel these sheets were the inputs to read and generate an initial geometry in the software, which speeds up the workflow in the modeling phase.
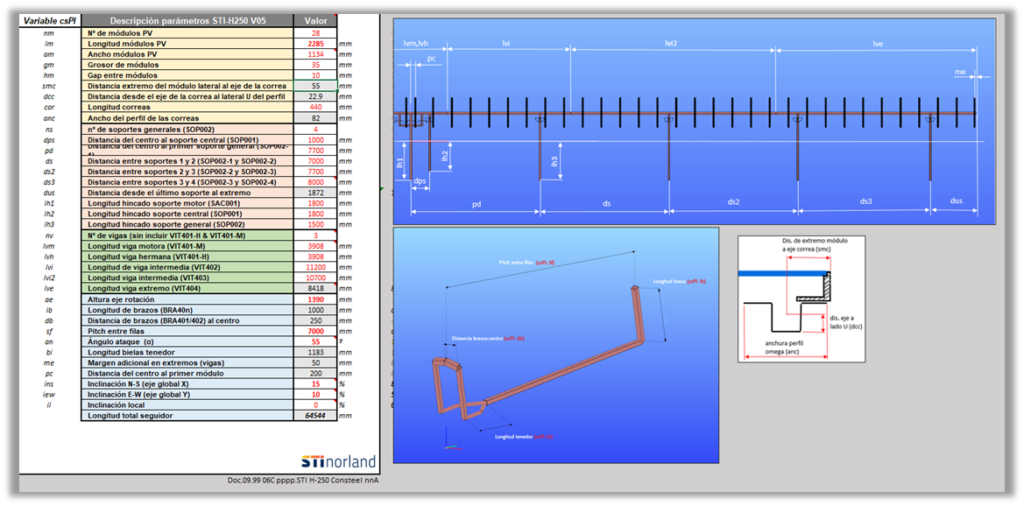
The algorithm developed by Array Technologies (STI Norland) in Consteel allows for the introduction of the corresponding loads onto the model. These loads are applied to the panels and consider the following aspects:
- Wind pressure on the panels, calculated using coefficients obtained from wind tunnel tests.
- Self-weight of the panels as specified by the manufacturer, including an additional amount to cover the weight of the cabling for panel installation.
- Self-weight of the structural elements.
The model includes the support structure where the photovoltaic modules are anchored, the torsion beam that holds all the panels, and the columns that connect these to the ground. Additionally, the model also includes the transverse mechanism that rotates the torsion beams to allow the panels to follow the sun’s trajectory.
THE VIRTUES OF CONSTEEL
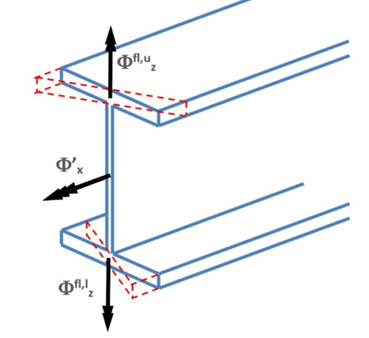
Among the most important virtues that Array Technologies (STI Norland) has highlighted in Consteel is its finite element modeling with 7 degrees of freedom. This capability allows for the consideration of stresses generated by warping in open profiles, which is crucial for structures susceptible to torsional and warping effects.
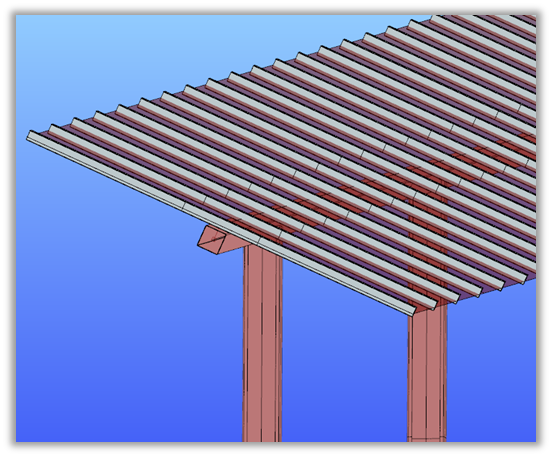
Another important aspect to mention is Consteel’s advanced handling of eccentricities between bars. This feature allows for accurate consideration of the influence and transmission of loads and deformations, not only recognizing the center of gravity of the profile but also the center of shear forces in open profiles. This capability enables Consteel to accurately reproduce the global behavior of the structure.
Additionally, Consteel allows for the determination of the global buckling modes of the structure (considering the 7 degrees of freedom) to accurately assess the buckling lengths for both flexure and torsion, even in elements with partial restraints, such as top-fixed purlins.
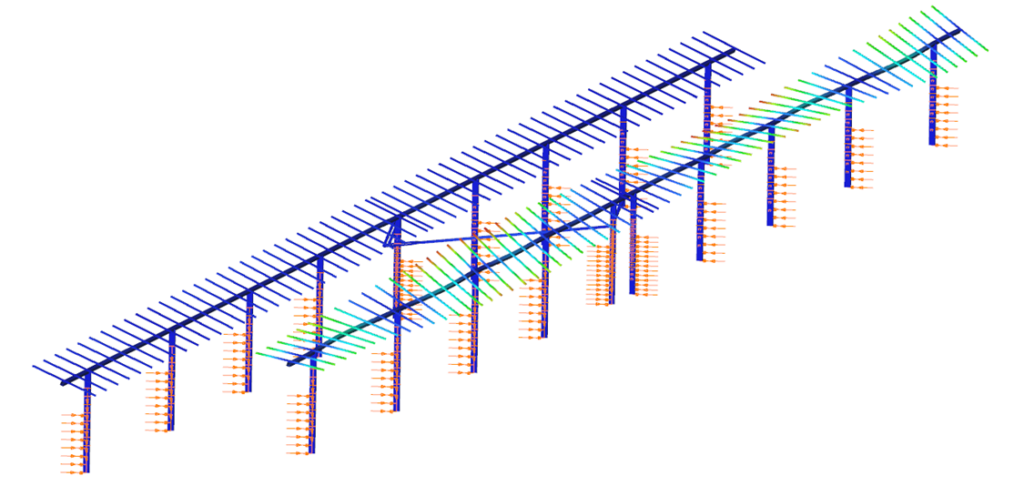
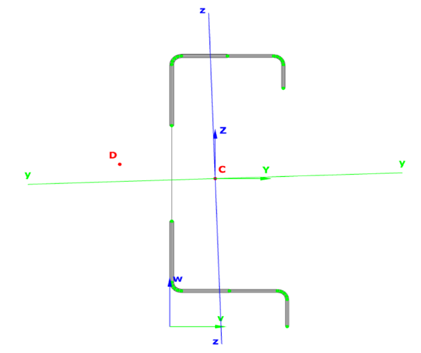
Perhaps one of the most powerful features of the program is its detailed analysis of cold-formed sections or Class 4 profiles. Consteel allows users to define any geometry using a special interface, and the software automatically calculates all the effective properties of the profile for each load combination and along the length of the bar, as these properties depend on the stress configuration in the section.
The software also stands out for its ease of use compared to other tools in the same field, and the high-quality graphical views provided during modeling. This feature allows users to get a clearer idea of the actual arrangement and the final result of the design. The importance of 3D modeling is emphasized, as it is the initial input for an analysis and modeling program, helping to ensure that the design is accurately represented and understood.